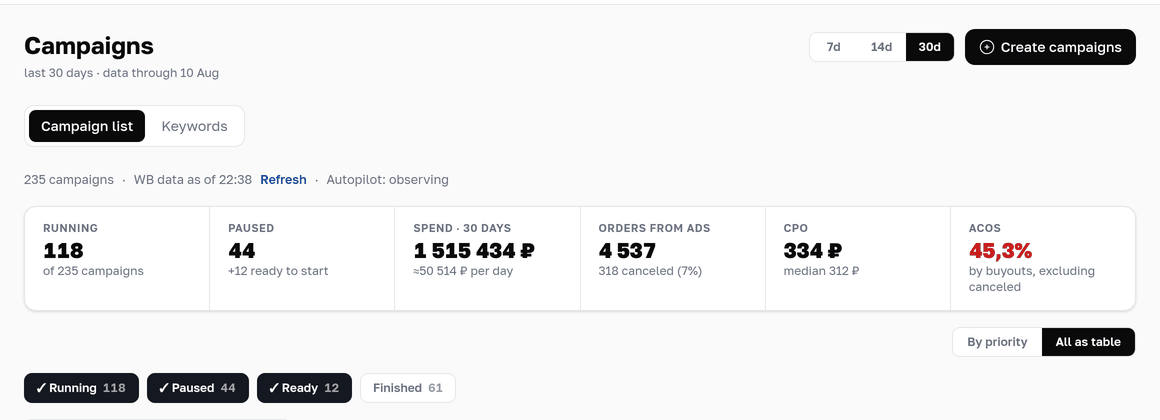
Advertising on Wildberries eats the budget quietly, a thousand roubles at a time. Eight months of daily stats from the ad account: 235 campaigns across eighteen stores, 1,515,434 ₽ of spend, 4,537 orders worth 3,345,751 ₽. The ad spend share across the whole set is 45.3%, the average cost per order 334 ₽.
An ad spend share of 45.3% means almost half the revenue from advertising went straight back into advertising. For a good number of categories that is working at break-even or at a loss. We went through the export campaign by campaign and keyword by keyword to find where exactly the money leaks.
One caveat up front: this is eighteen stores in a few niches, not an industry benchmark. Everyone has their own niche, margin and season. What reproduces is the method, not the numbers.
Ad spend share and CPO: how to count without fooling yourself on step one
Two metrics everything revolves around: ad spend share, that is spend divided by revenue, and CPO, spend divided by the number of orders.
Both are counted as a sum over a sum: add up all the spend of a group, add up all its revenue, divide one by the other. The temptation to take each day's ad spend share and average them looks harmless, but it gives a different number: a day with 40 ₽ of spend gets the same weight as a day with 8,000 ₽.
Mistake 1. Campaigns sit above the ad spend share threshold for months
The biggest loss item turned out to be a boring one. 56 campaigns ran for a month or longer with an ad spend share above 30%. They took 861,260 ₽, which is 57% of the whole sample budget.
The 30% threshold is not a law of physics. Break-even is worked out from the margin of the specific product: one product has 18%, another 40%. But holding a campaign above any sensible threshold for months without making a decision is not a strategy, it is the absence of a process.
What to do. Work out the ceiling ad spend share for every product: margin before advertising divided by price, where commission, logistics, storage, cost of goods, tax and expected returns are already out of the margin. Then the rule: a campaign stays above its threshold for as long as three to five target CPOs of spend, after that it gets paused or rebuilt. Measure spend, not the calendar: two weeks with three orders prove nothing.
Mistake 2. Nobody stops campaigns with zero orders
40 campaigns out of 235, every sixth one, have spend and zero attributed orders over their whole life. Together 49,841 ₽, an average of 1,246 ₽ per campaign.
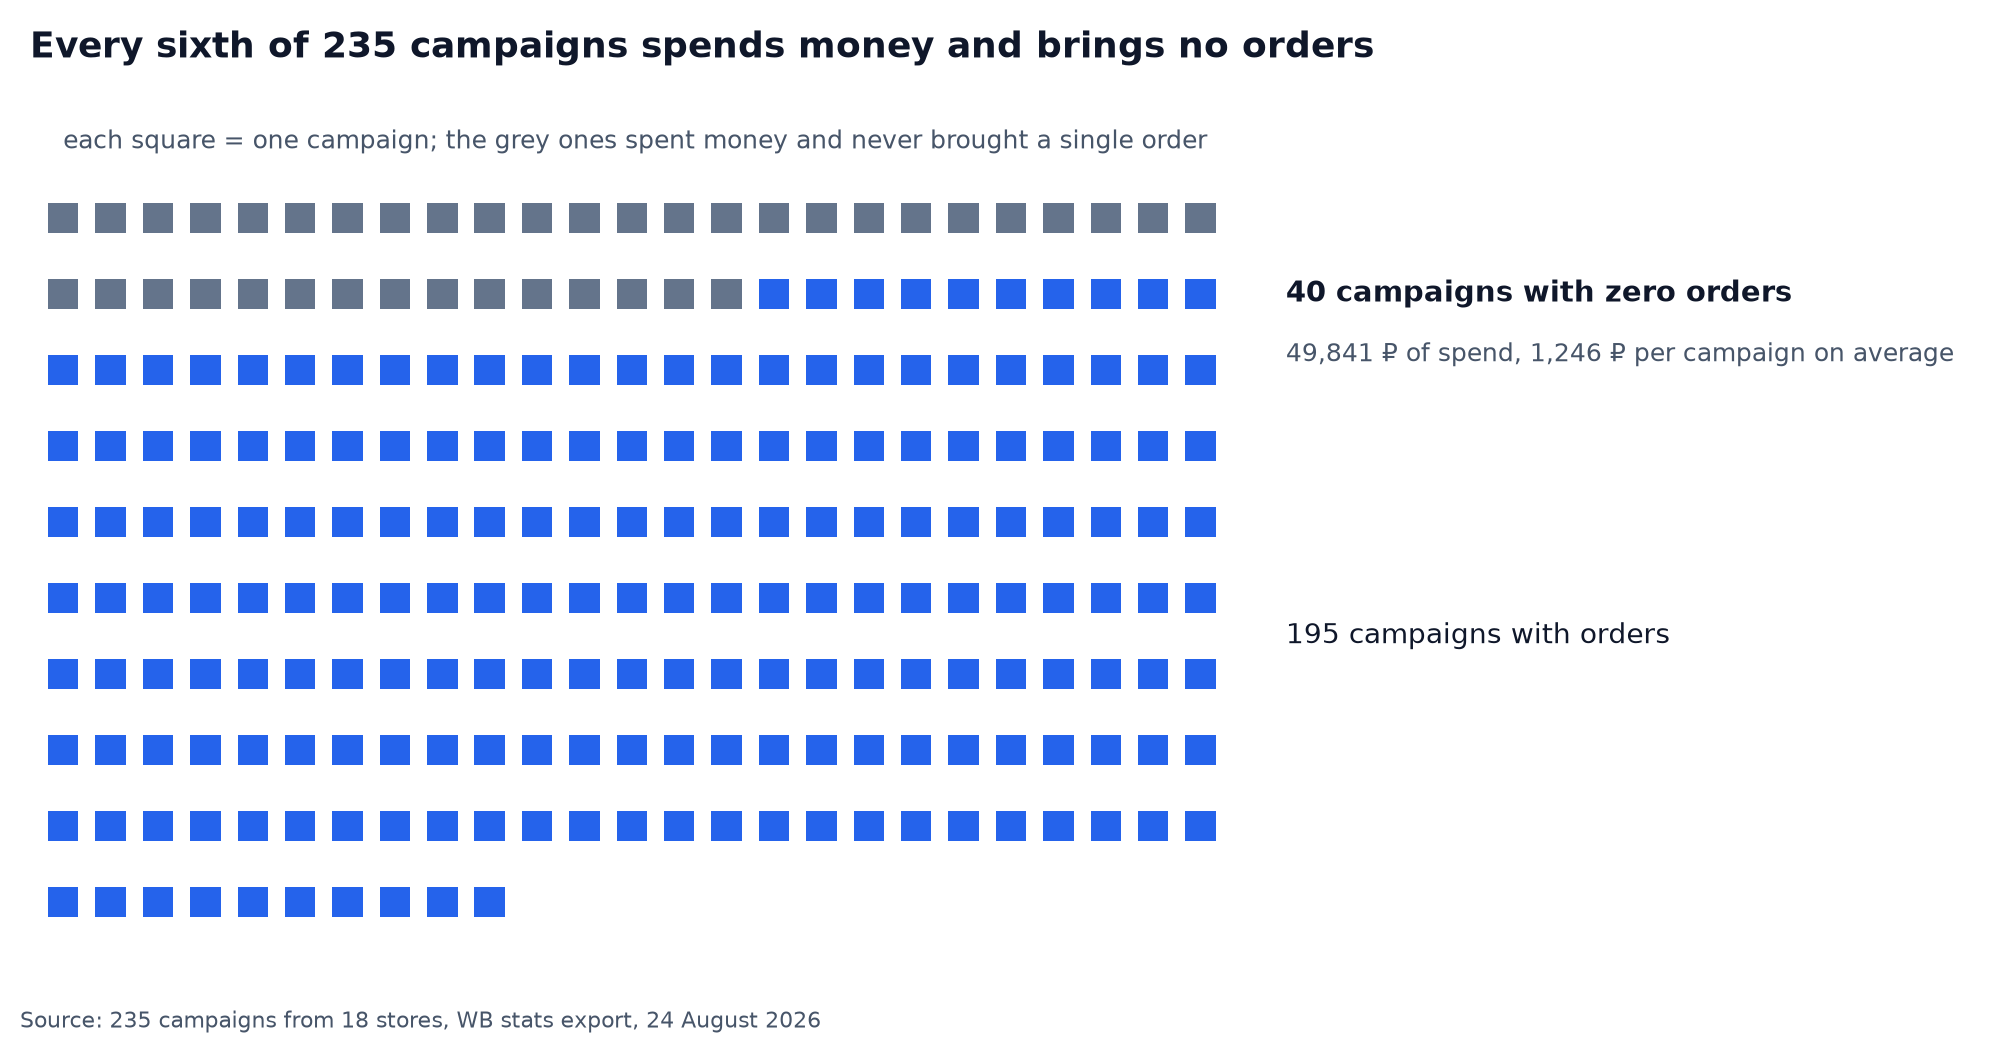
The trap is in the size of the sums: a thousand roubles, fifteen hundred, two. The eye does not catch that, in a report it does not look like a problem, and over eight months it adds up to fifty thousand.
What to do. Once a week sort campaigns by spend where orders are zero. The threshold is not in roubles but in your own cost per order: it spent one and a half to two of those and stayed silent, so stop it and go look at the product card. With a correction for the attribution window: orders arrive with a delay.
Mistake 3. Junk queries that nobody adds to the negative list
42 phrases collected twenty clicks or more each and zero orders. Together 128,555 ₽, which is 8.5% of the sample budget.
The most expensive case: one phrase from an adjacent entertainment topic with nothing to do with what the product is for: 3,273 clicks, 30,829 ₽, zero orders. The platform was mixing the card into a high-frequency query from a neighbouring subject, and the click was cheap precisely because it meant nothing.
The second typical case, a broad category name: 577 clicks, 9,195 ₽, zero orders. Wide phrases steadily gave clicks and no purchases.
The concentration stands out on its own: the top 10 phrases took 54.9% of all keyword spend. A weekly look at ten rows covers half the budget.
What to do. Decide by money, not by the number of clicks: a phrase has burned one and a half to two acceptable CPOs with no order, so it is a candidate for the negative list. At a card conversion of 5%, twenty clicks without an order is not yet a verdict. And remember: while a phrase sits in the negative list it gets no impressions, and you will never find out whether it could have sold.
Mistake 4. Low CTR on Wildberries ads as an early signal everyone ignores
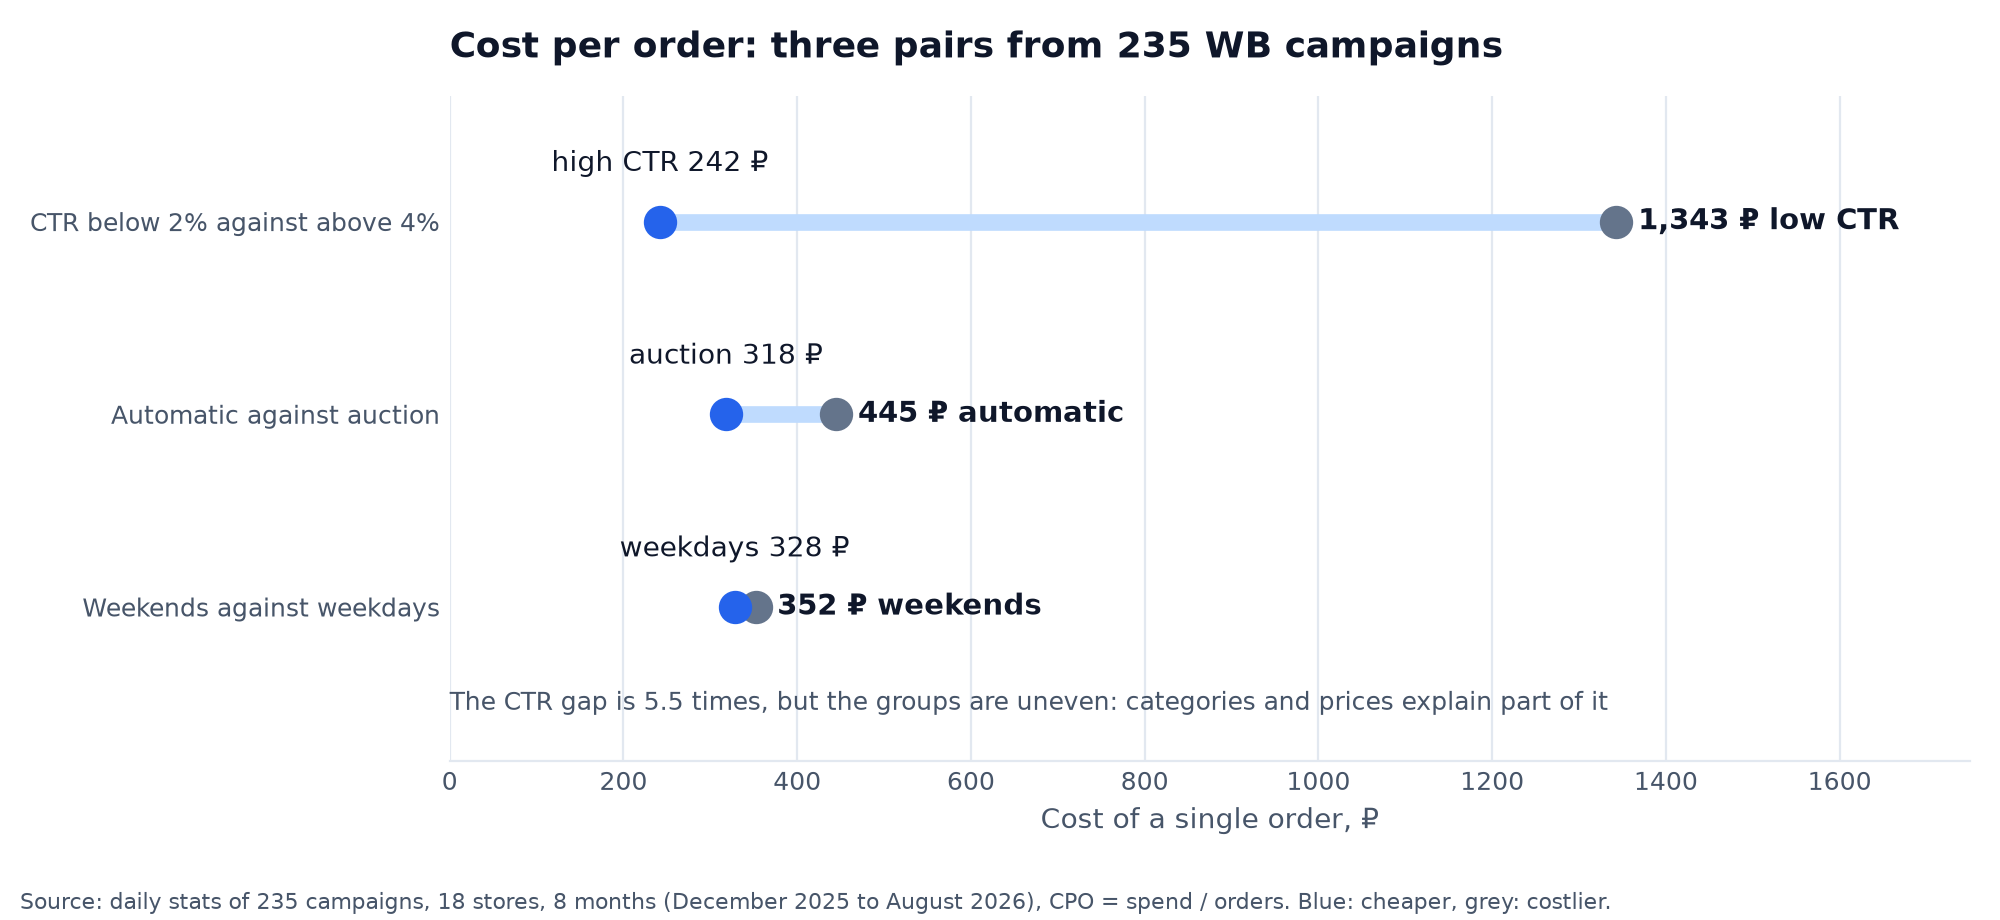
61 campaigns with a thousand impressions or more had a CTR below 2%. Their spend is 175,878 ₽. In that group an order cost 1,343 ₽, in campaigns with a CTR above 4% it cost 242 ₽. A difference of 5.5 times.
An honest caveat belongs here: this is a correlation across uneven groups. Products, categories and prices inside the groups differ, and part of the gap is explained by them rather than by CTR itself. But as an early signal CTR is useful: it shows up after a few hundred impressions, while the cost per order only appears once the money is gone.
A low CTR is a diagnosis for the pair of product card plus query: either the main photo loses to the neighbours in search, or the price stands out, or the product is shown to the wrong people. Fix one element at a time, otherwise you will not know what worked.
Mistake 5. Auction against automatic campaigns: "the automatic one will sort it out"
Of the 235 campaigns, 192 are auction and 43 automatic. Cost per order: 318 ₽ for auction against 445 ₽ for automatic, a difference of 40% not in the automatic one's favour. The cost per click is almost the same: 10.9 ₽ against 10.1 ₽.
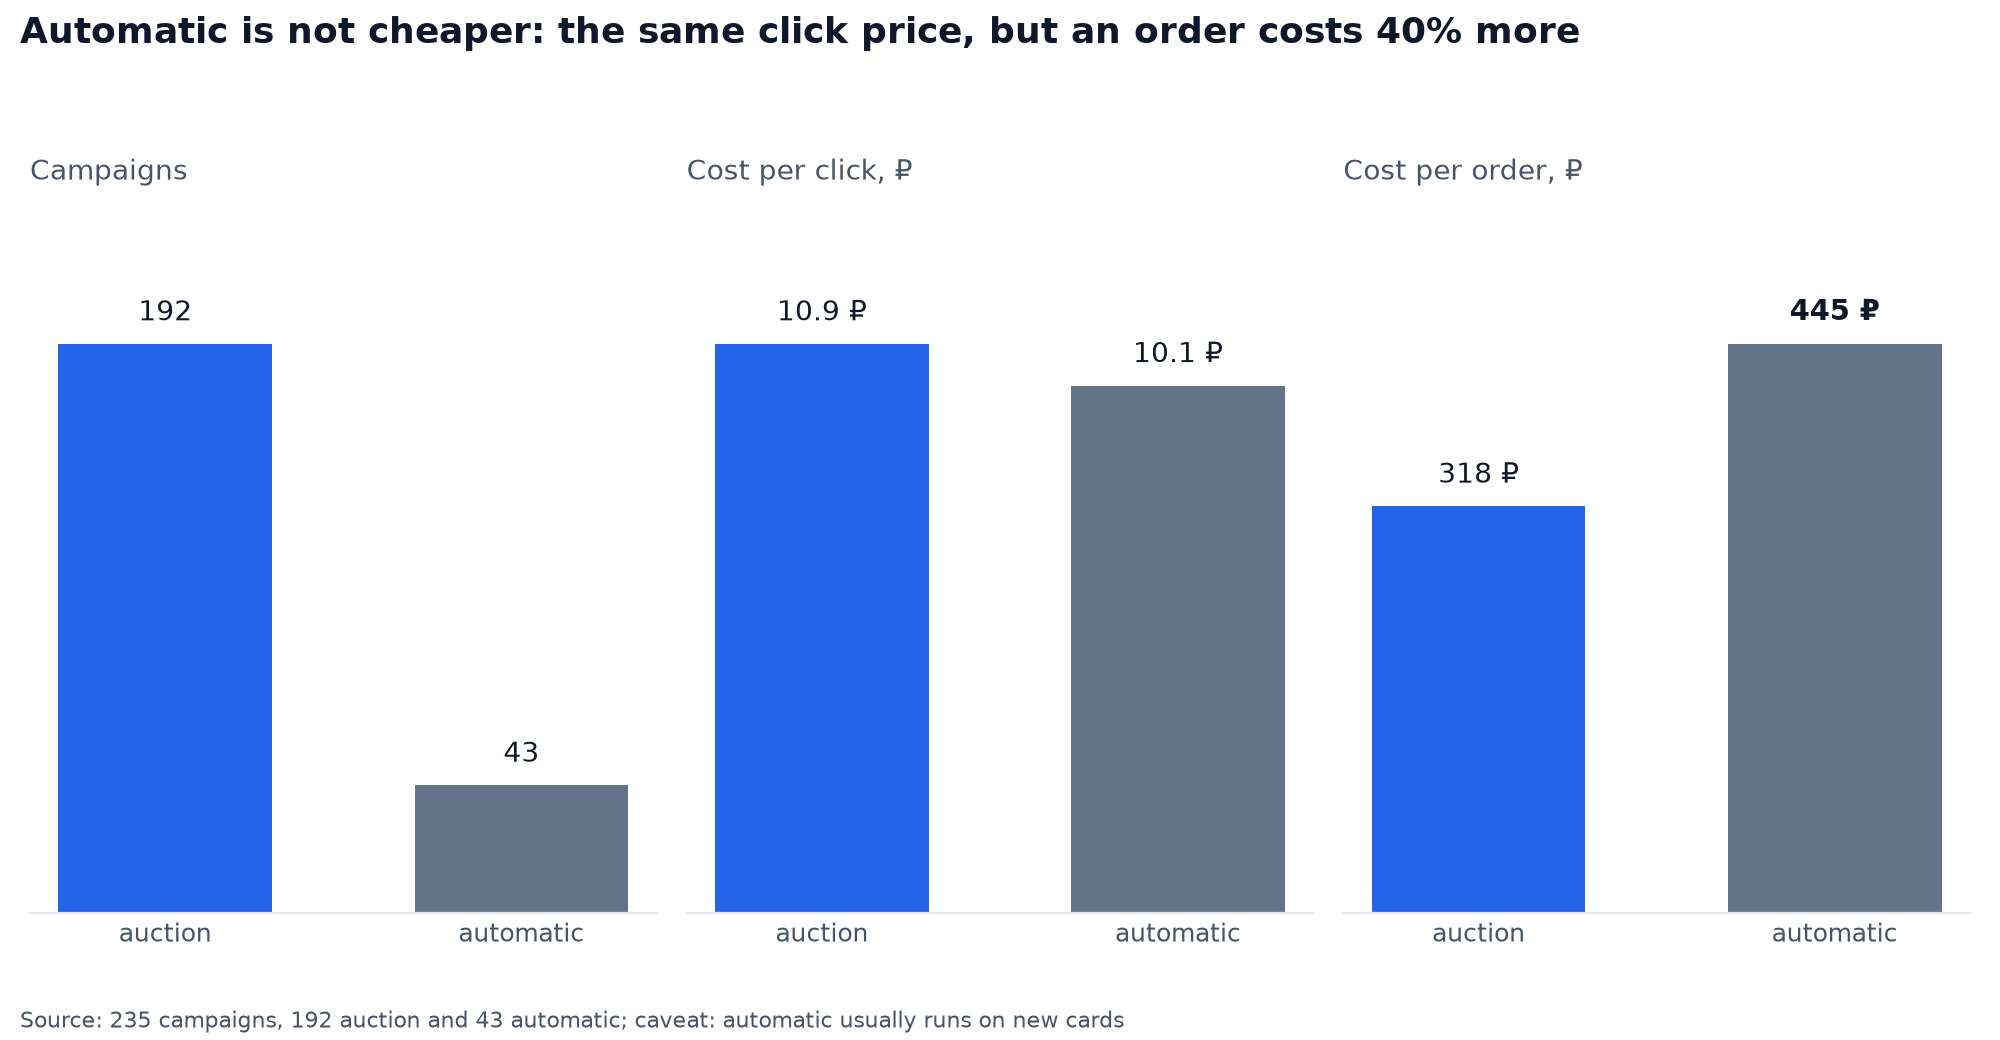
So the automatic campaign is not "cheaper", its traffic converts worse. The same caveat applies: automatic campaigns usually go on new cards and auction on proven pairings, and part of the gap comes from that. What definitely follows from the numbers: judging a campaign by the cost per click is pointless, the metrics here are cost per order and ad spend share.
Mistake 6. The same bids seven days a week
At weekends the ad spend share of the sample is 50.7%, on weekdays 43.6%. Cost per order 352 ₽ against 328 ₽.
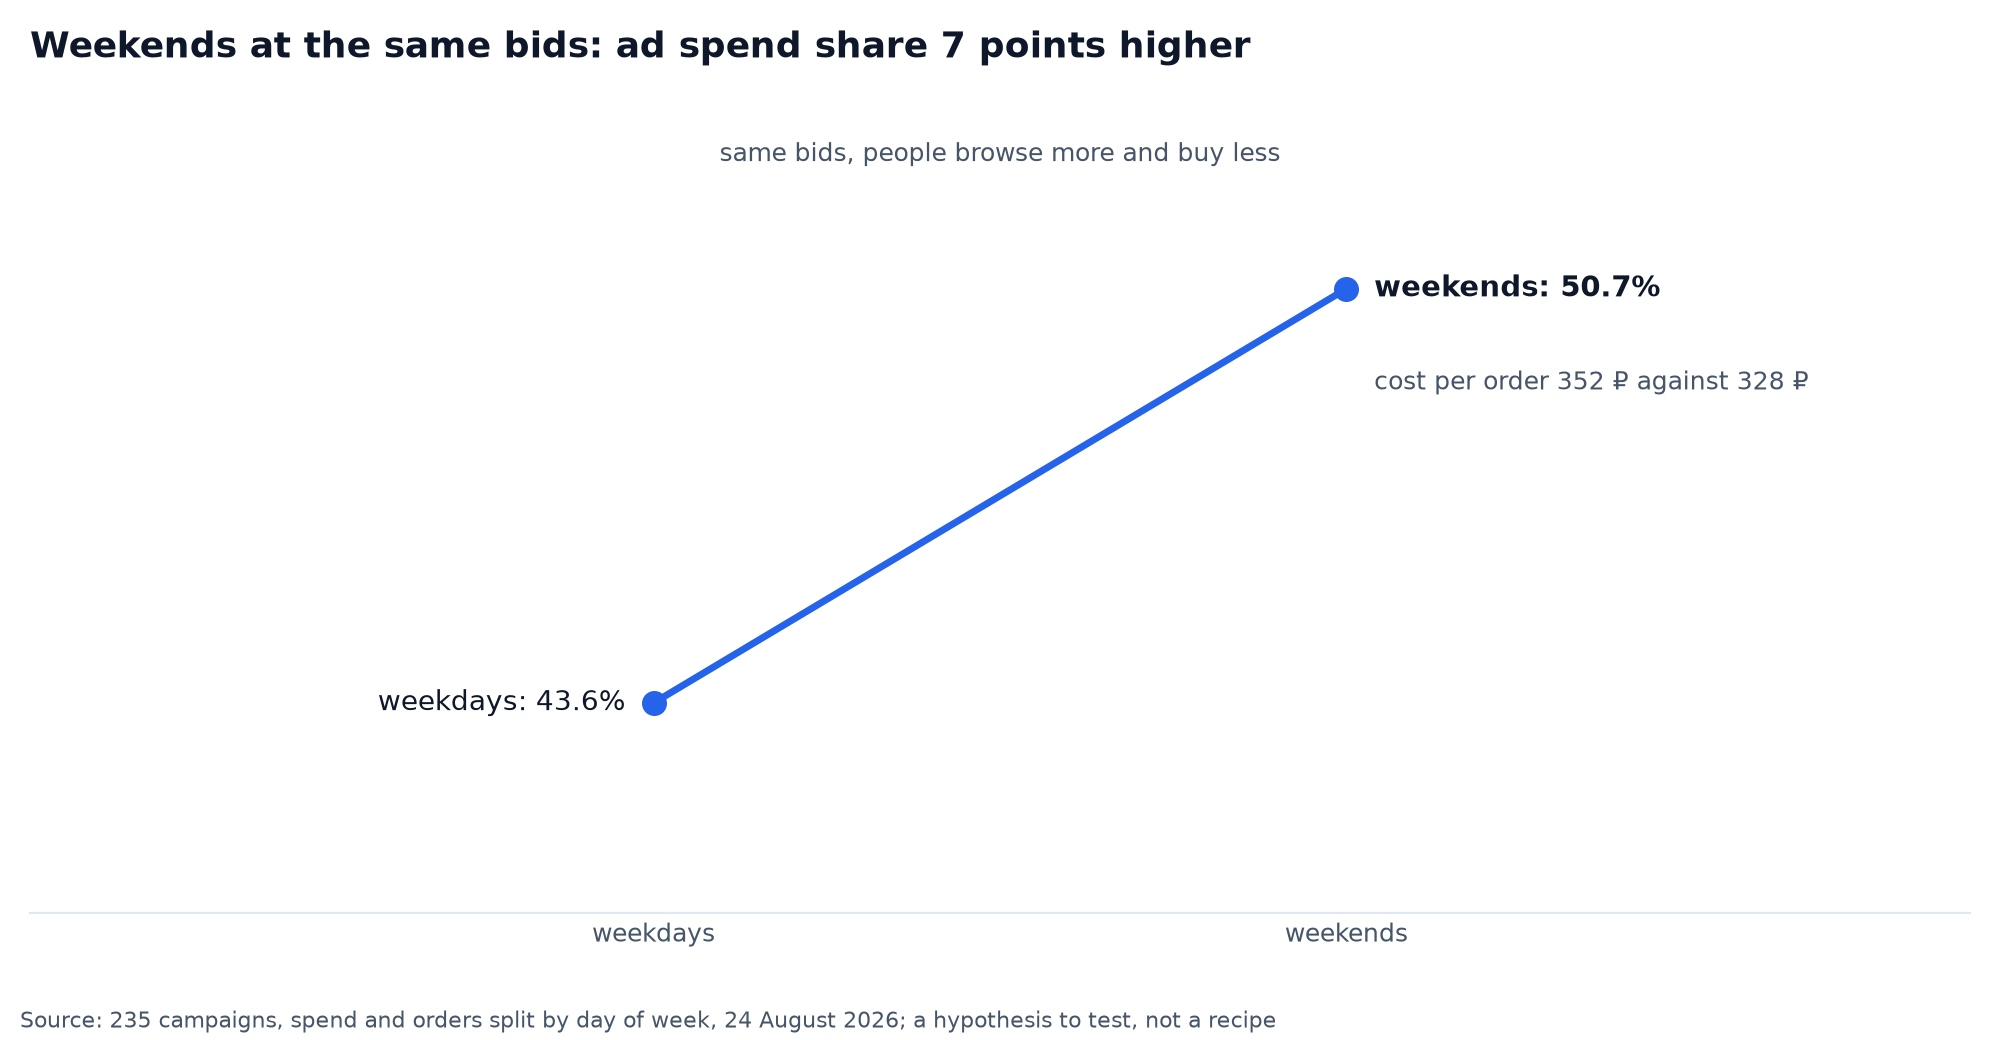
Weekend traffic behaves differently: people browse more and buy less, while bids stay at weekday levels. It does not follow from this data that lowering bids at weekends will keep the orders, that is a hypothesis to test: a couple of weekends with bids 10–15% lower, a couple with no changes, then compare.
Three traps in the data itself
While counting we got a beautiful answer three times and were wrong three times. Not because of the arithmetic, but because of how the export is built.
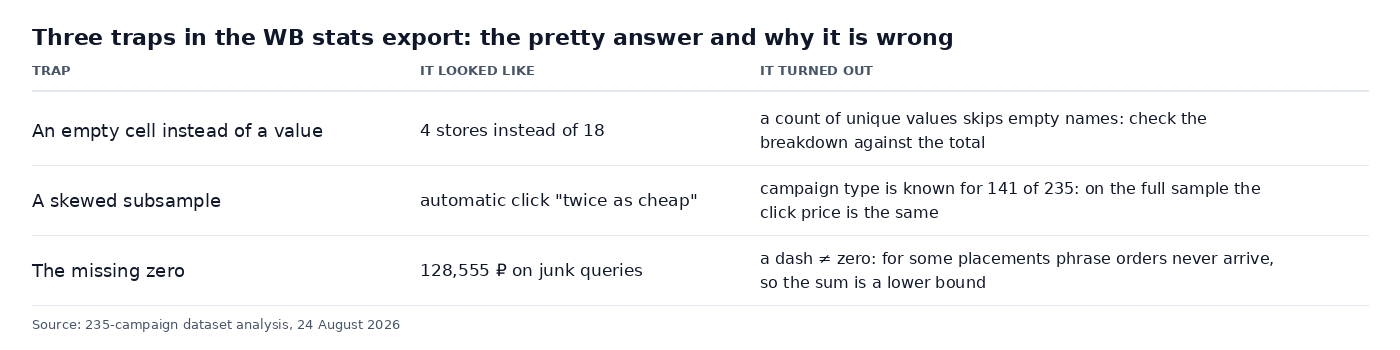
An empty cell instead of a value. Counting unique stores gave four. A day later it turned out the breakdown does not add up to the total: 55,000 ₽ against a million and a half. The store name is not filled in on older rows, and any count of unique values skips empty cells. There were eighteen stores.
A skewed subsample. The campaign type is not in the main report, it is pulled from the keyword stats, and after the join it was there for 141 campaigns out of 235. On that half it looked like a click in an automatic campaign costs half as much: 7.0 ₽ against 13.3 ₽. The pretty conclusion held until it became clear that the rest of the campaigns are missing a type for a reason: the keyword report is not filled for every placement format. On the full sample the cost per click turned out to be the same.
A zero that is not there. The "zero orders" filter catches only rows where orders for the phrase came back at all. For part of the auction placements, orders at the phrase level do not arrive at all, and the cell holds a dash rather than a zero. In the report they look identical and they mean different things: "there were no sales" and "there is no data". So 128,555 ₽ on junk queries is a lower bound, not a measured figure.
What it adds up to
The groups overlap and the rows cannot be summed: one campaign lands in several at once.
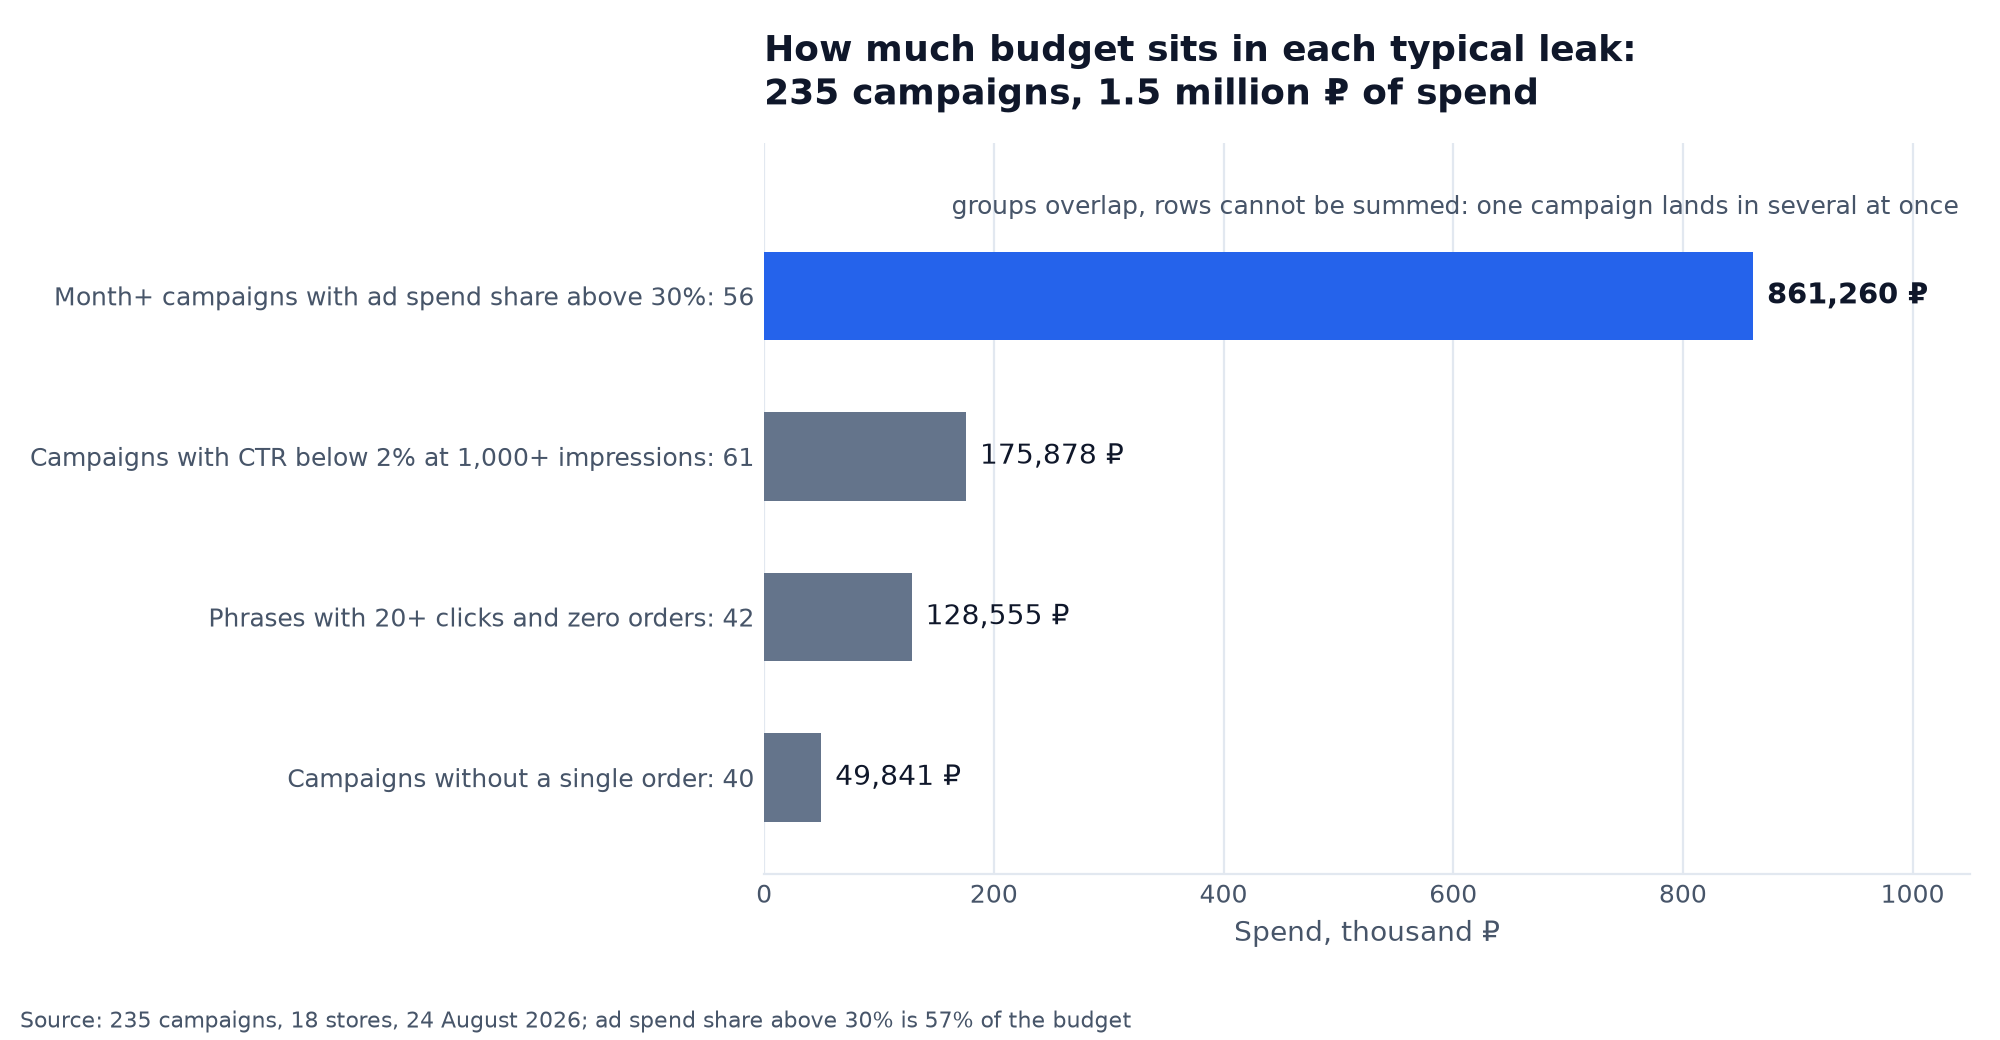
- Campaigns running a month or longer with an ad spend share above 30%: 56 of them, 861,260 ₽, 57% of the budget
- Campaigns without a single order: 40 out of 235, 49,841 ₽
- Phrases with 20+ clicks and zero orders: 42 of them, 128,555 ₽
- Campaigns with a CTR below 2% at 1000+ impressions: 61 of them, 175,878 ₽
- Automatic campaigns: 43 out of 235, cost per order 40% higher than auction
- The same bids all week long: plus 7 percentage points of ad spend share at weekends
Empty campaigns and empty phrases alone are 178,000 ₽, 12% of the sample budget, with not a single order behind them.
How this turns into a process
A one-off review gives you a list of regrets. Results show up when the check becomes weekly. For us that is four queries:
- Campaigns with spend above one and a half to two target CPOs and zero orders, corrected for the attribution window.
- Campaigns whose accumulated ad spend share stays above the product threshold for as long as three to five target CPOs of spend.
- Phrases with spend above one and a half to two CPOs and zero orders, candidates for the negative list with an eye on the card's conversion.
- Campaigns whose CTR has dropped against the median of their own campaigns in the same format.
The thresholds here are not universal numbers, they are functions of your margin. The target CPO equals the margin before advertising. The ceiling ad spend share equals that same margin divided by the price.
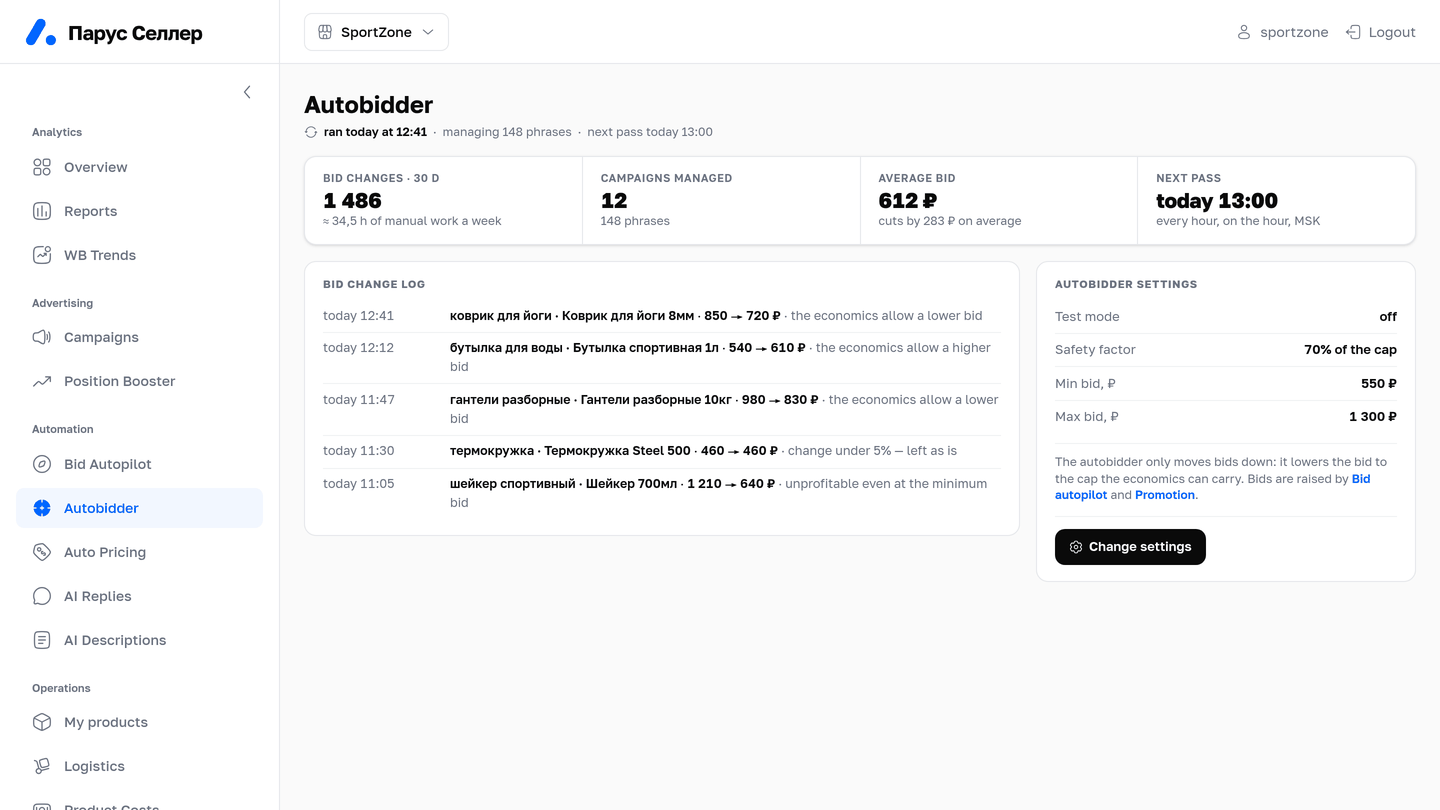
In Parus Seller these checks run on a schedule, and bids are changed by automation inside corridors you set, with a log that shows what changed, when and by which rule. That is exactly the difference from the platform's own automatic campaigns: you set the thresholds and the limits, and every decision can be looked at afterwards and rolled back.
You can try it for free: promo code PARUS60 gives two months of full access with no card, sign-up with the promo code already in the link. Connecting by API key takes a couple of minutes.
And how much the leaks you find are worth in the net profit of a specific product is counted in a neighbouring piece: Wildberries unit economics with a calculator and a sheet.