Download the Wildberries unit economics sheet (xlsx, free, no sign-up)
The sheet holds 12 inputs you take from your own seller portal and 11 formulas that work out the rest: commission and logistics adjusted for the buyout rate, advertising per sale, tax, net profit per unit, margin, the ad spend share ceiling and the break-even price. Only the yellow cells need filling. The file opens in Excel, Google Sheets and Numbers, and there are no macros.
The most expensive myth a Wildberries seller believes sounds like this: sold it for 1,500, bought it for 500, so I made a thousand. Out of that thousand the commission, logistics both ways, storage, advertising, tax and returns leave quietly, and 200 roubles are left. Sometimes minus 80, and nobody ever counted it.
Unit economics answers one question: how much one sale of one specific product brings in net, after every deduction. Below is the full formula, what each row of the sheet means, and a way to check your model against a real WB report.
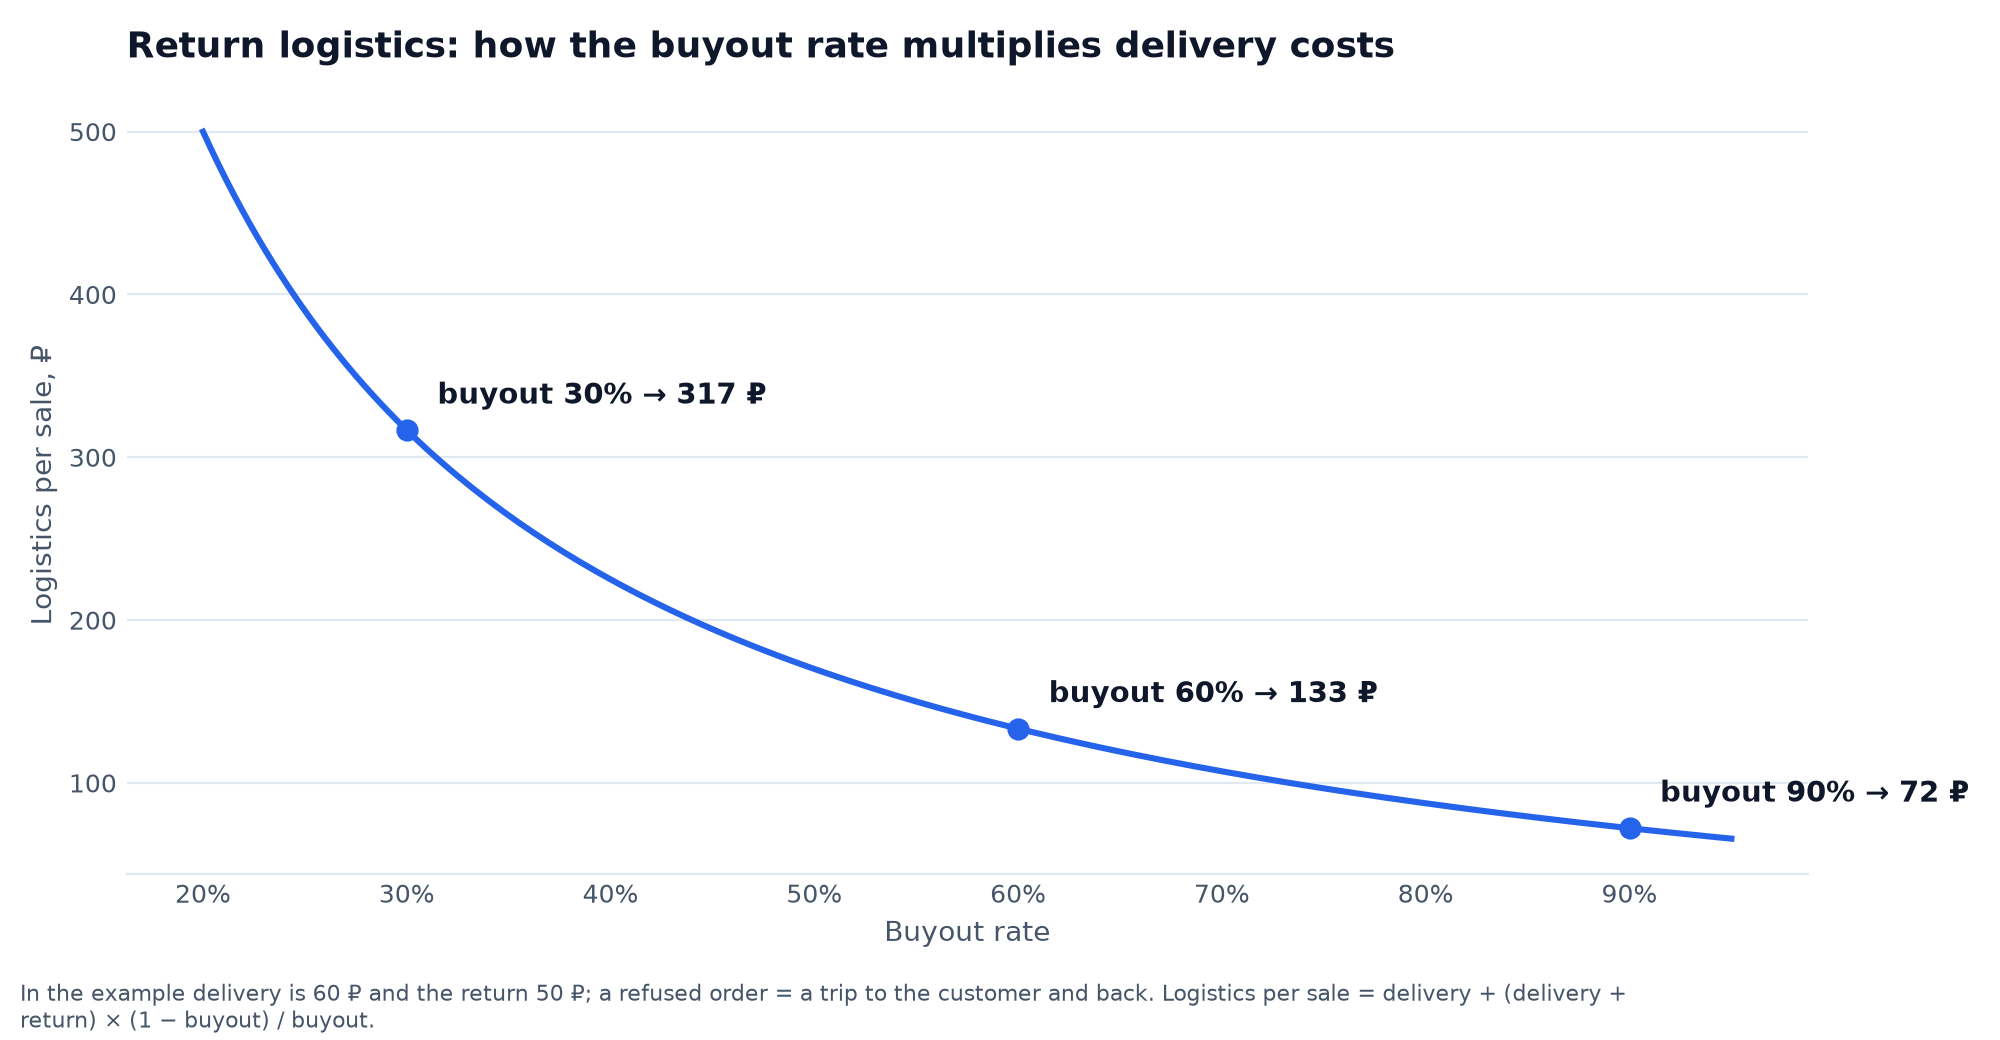
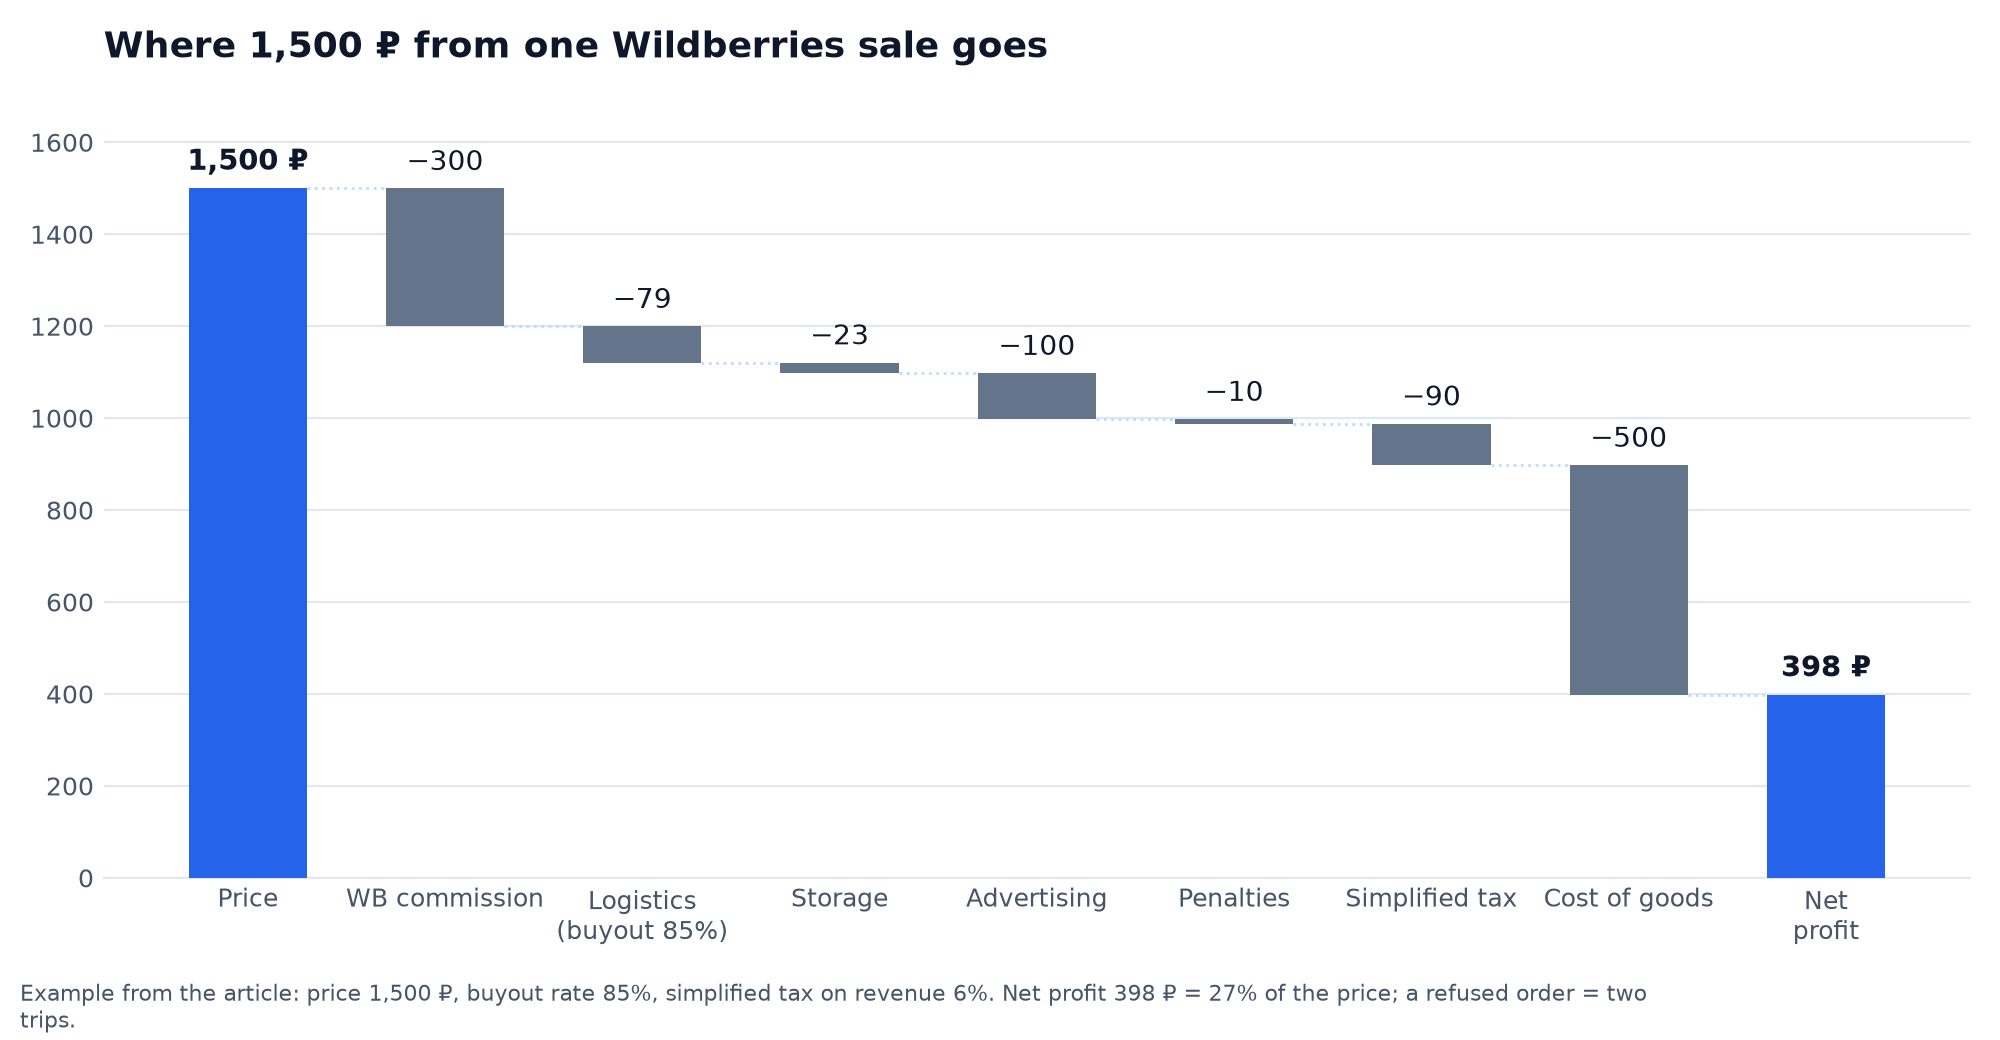
In short: profit per sale = price minus eight deductions. The biggest eaters are the logistics of refused orders when the buyout rate is low (up to 317 ₽ per sale at a buyout rate of 30%), advertising, and tax on revenue. The free sheet works it all out at once, and the model has to be checked against the weekly WB report.
The same formulas without Excel are in the online Wildberries profit calculator: the commission comes from the WB API by category, logistics by litre.
Eight deductions from every sale
- WB commission. A percentage of the price, different in every category. Check the current one in your seller portal under Rates → Commission, not in someone else's article.
- Delivery to the customer. A flat rate that depends on the dimensions and the warehouse.
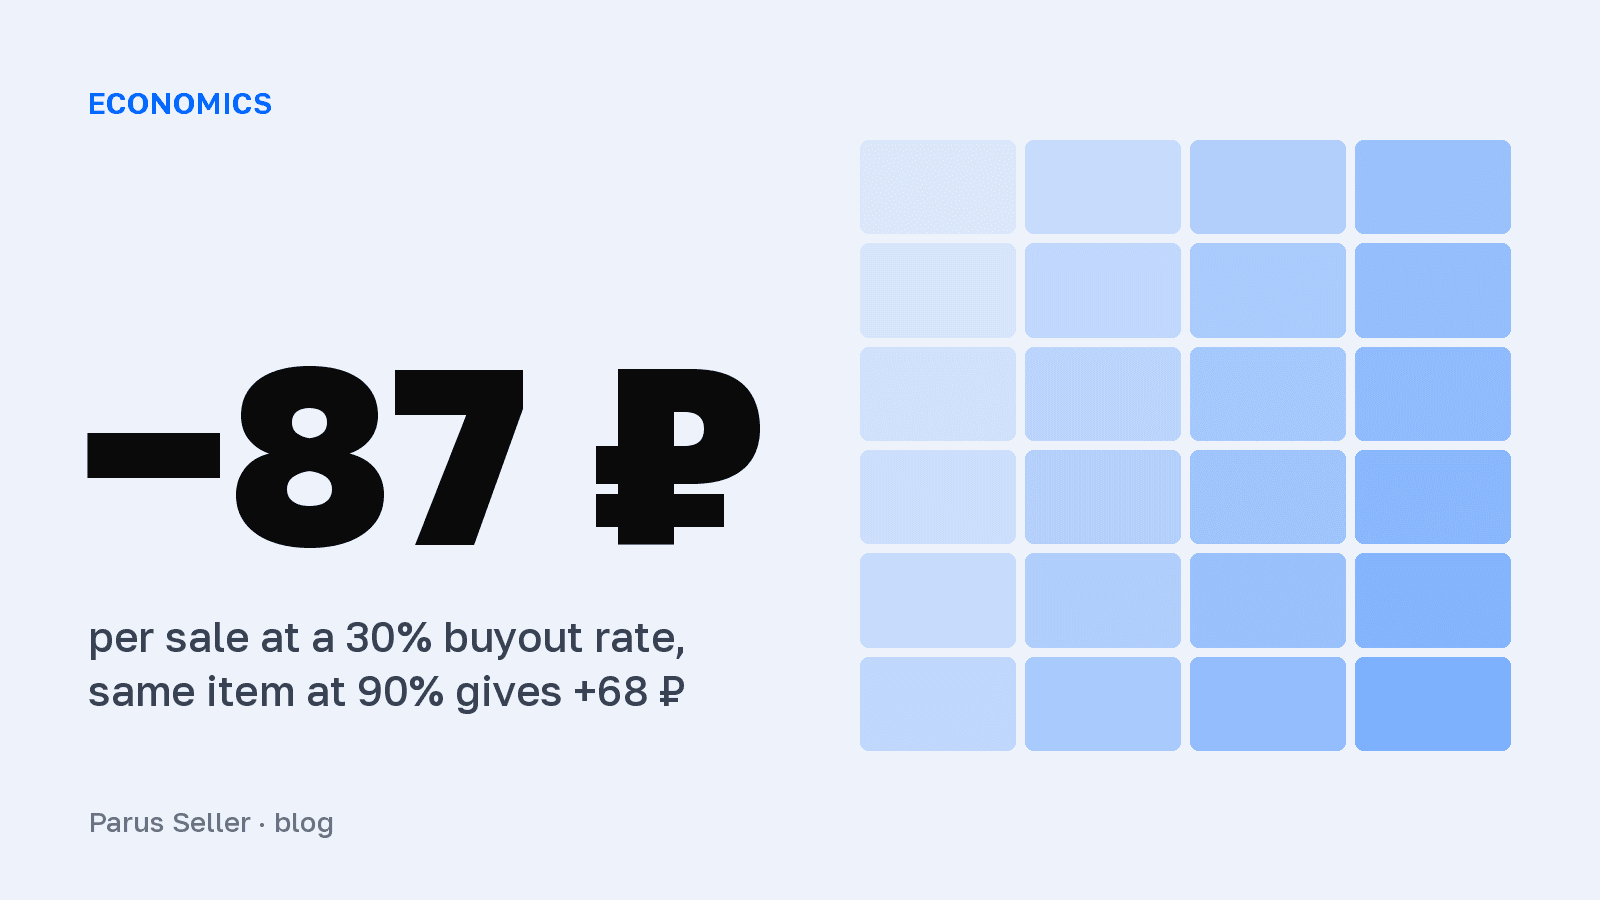
- Return logistics. This is where most calculations die: at a buyout rate of 30% every sale carries another 2.3 refused orders, and each of those is two trips you paid for, to the customer and back. A "profitable" dress at 2,000 roubles with that buyout rate ships losses. More on the metric: buyout rate on Wildberries, where to find it and the norms by category.
- Storage. Kopecks per unit per day. When stock takes 90 days to sell through, those kopecks turn into a visible slice of the margin.
- Advertising. Spend divided by orders from ads is your CPO. A campaign with an ad spend share of 30% means a third of the revenue from ad-driven sales went straight back into the ad account. Where advertising leaks most often, we broke down on data from 235 campaigns: six typical budget leaks.
- Penalties and deductions. Marking, substitutions, paid inbound acceptance. Small on their own, over a month they add up to another commission.
- Tax. The simplified tax on revenue at 6% is charged on all revenue, not on what landed in the bank account. At a turnover of 1,000,000 and a margin of 15%, a tax of 60,000 takes 40% of the profit.
- Cost of goods. Purchase, delivery to the warehouse, packaging, defects.
Honest logistics is counted per sale, not per shipment:
Logistics per sale = delivery + (delivery + return) × (1 − buyout rate) / buyout rate
And the full formula:
Net profit = price − WB commission − logistics adjusted for the buyout rate − storage − advertising per sale − penalties − tax − cost of goods
An example on real numbers: an item at 1,500 ₽, commission 20%, buyout rate 85%, cost of goods 500 ₽, CPO 250 ₽ with 40% of orders coming from ads. Net comes to 398 ₽, the margin is 27%, and the break-even price is 962 ₽. All eight deductions are already in that example, and you can run your own product through the sheet below.
The free calculator sheet
Enter the price, the commission, the cost of goods, the buyout rate and the ad spend. The sheet works out net profit per unit, margin, the ad spend share ceiling and the break-even price.
Download the unit economics sheet for Wildberries (xlsx, free)
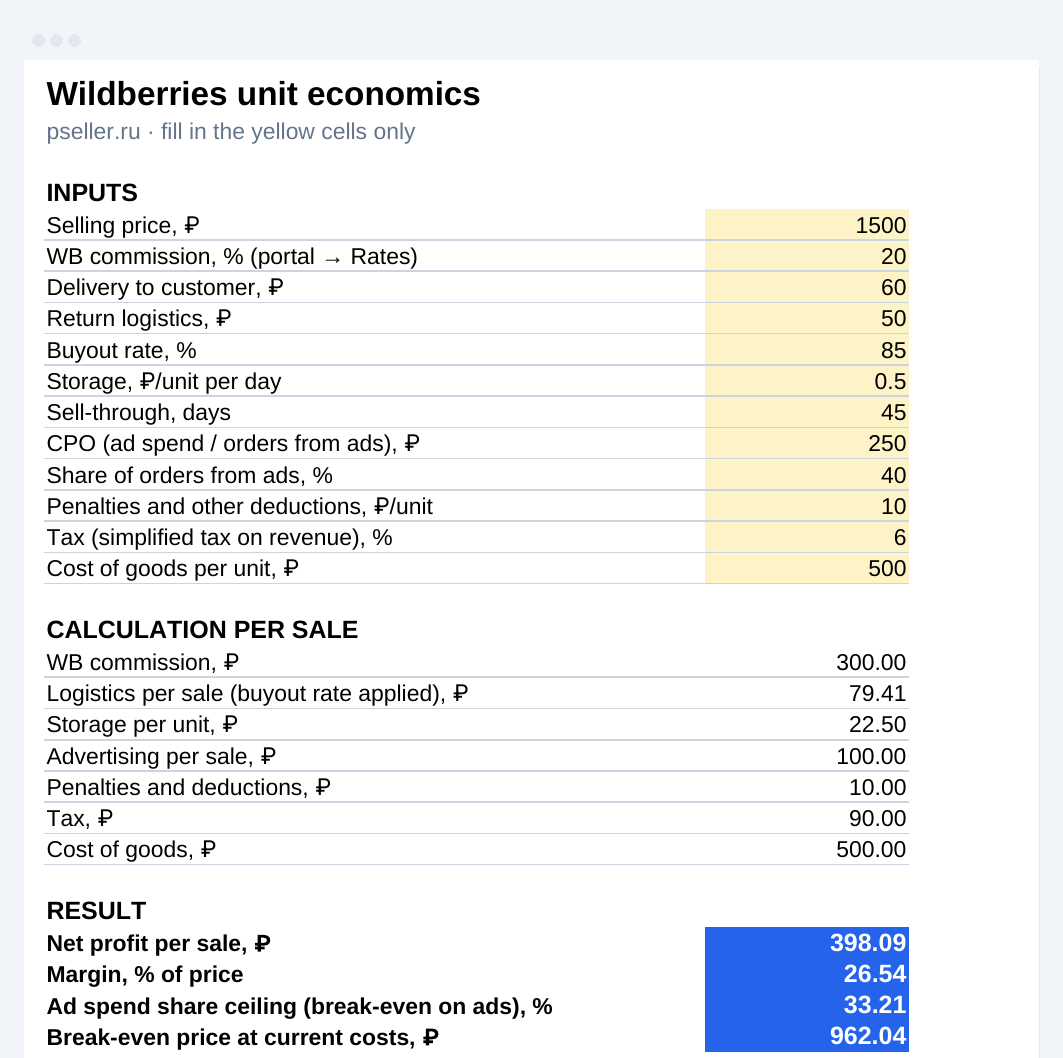
It works in Excel and Google Sheets. No macros, the formulas are open, the yellow cells are for input. For a quick single-sale calculation without downloading anything there is an online Wildberries profit calculator with category commissions pulled from the WB API.
Why the sheet will still be wrong
Any sheet, ours included, computes a model. The facts live in the WB weekly settlement report, and the two diverge for four reasons:
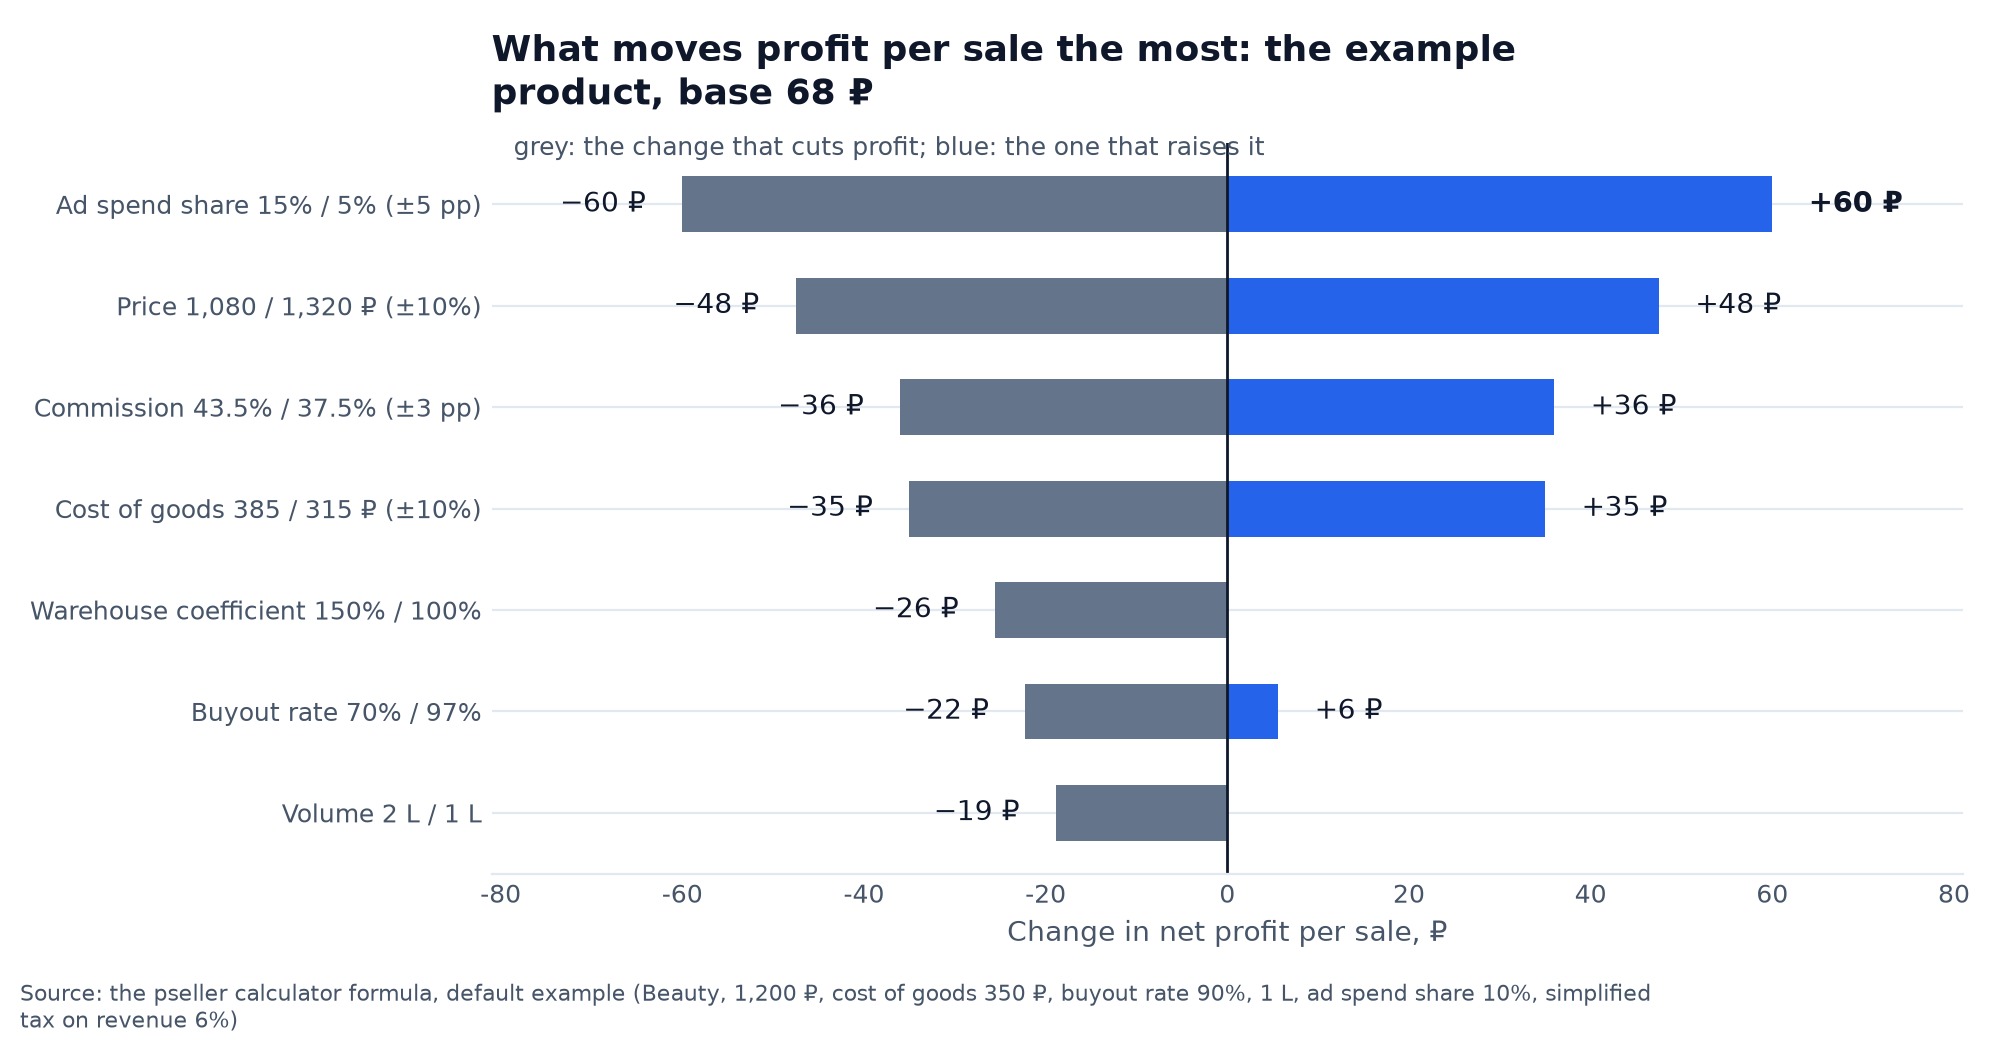
- Rates drift. Commissions and logistics change several times a year. A sheet filled in in March is lying by August.
- The buyout rate floats. You assumed 85%, the return season pushed it to 70%, and logistics per sale grew by half.
- Deductions arrive after the fact. A marking penalty, an inbound acceptance adjustment, last month's storage. They are in the report and will never be in the sheet.
- Advertising is smeared across campaigns. Honest spend per vendor code is collected from every campaign the item runs in. By hand that is an hour a week for a dozen items.
The working scheme: the sheet for planning before you buy, the report for checking the facts. Once a week compare what was actually deducted against the model. If the gap is more than a couple of percent, look for the reason. How the report itself is built by column and how to check its formula, we went through in our article on the weekly Wildberries report.
What this looks like without the manual work
We build Parus Seller, a service that does this reconciliation itself: it pulls WB reports over the API and breaks net profit down with every actual deduction, including advertising from all campaigns and penalties charged after the fact.
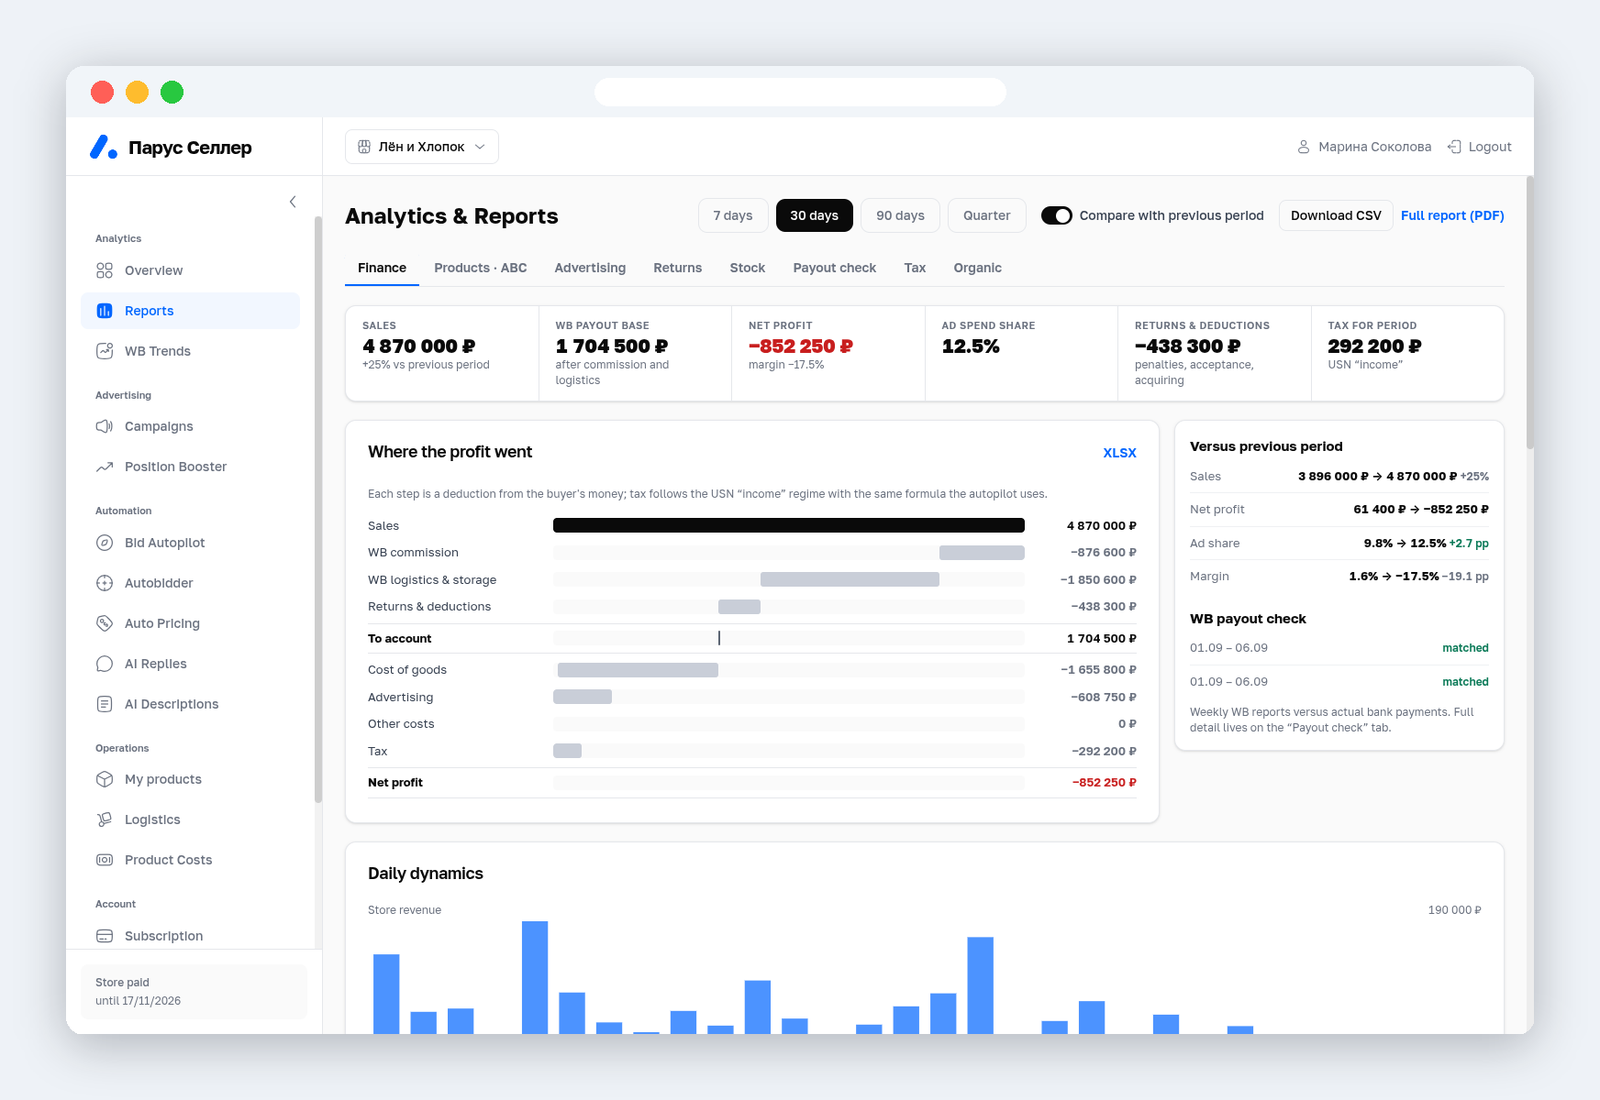
The screenshot shows a store that spent a month running at a loss: 4,870,000 ₽ of sales turned into −852,250 ₽ net, and the steps show exactly who carried the money off. In a sheet the owner would have seen "sales grew 25%" and been pleased.
Separately the service reconciles payouts: how much WB should have transferred according to the report and how much actually reached the account, down to the rouble.
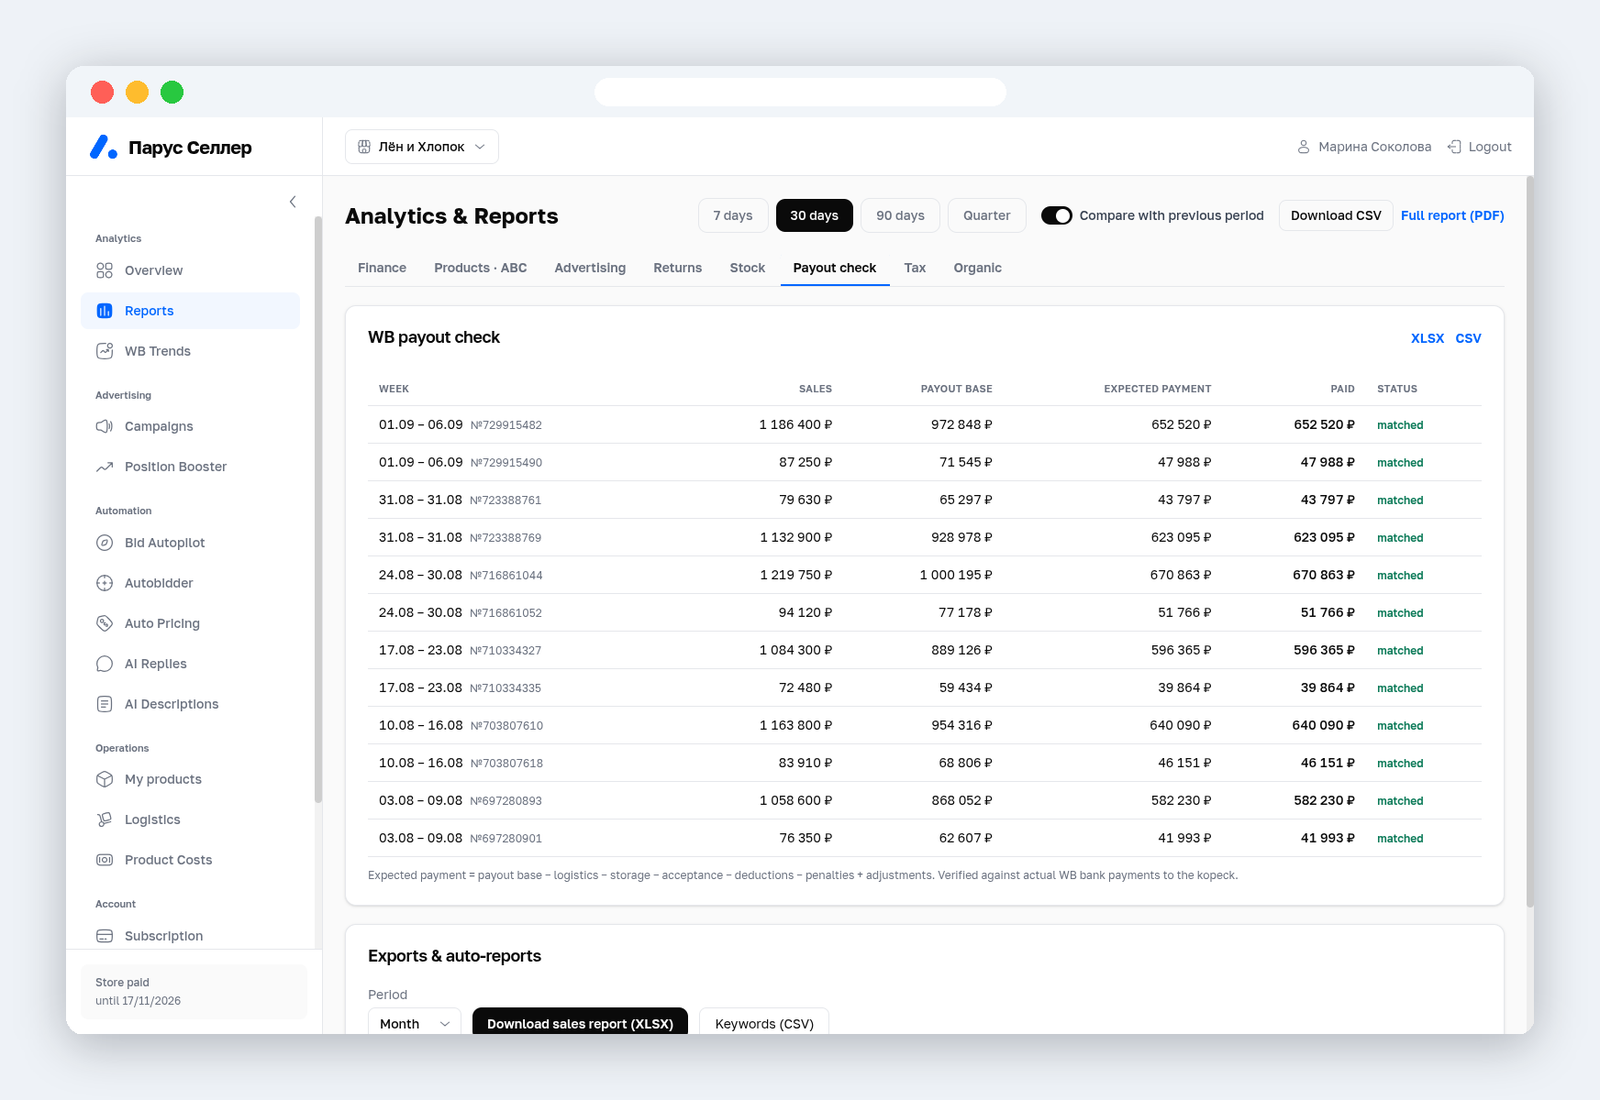
First two months free with promo code PARUS60, no card required: sign up and connect your seller portal. Connecting by API key takes a couple of minutes, the key is created in the WB seller portal and revoked in one click.
FAQ
What is unit economics on Wildberries in plain terms? The profit from a single sale of a single product after all costs: commission, logistics, storage, advertising, taxes and cost of goods. It shows whether a product earns or ships money at a loss.
How do you calculate unit economics with VAT? If you are on the general tax regime (OSNO), VAT comes out of the price first and the rest of the calculation runs on the net amount. On the simplified tax on revenue VAT is not part of the calculation, but remember that the 6% is charged on all revenue.
Is the calculation different for FBS? Yes. Instead of FBO rates you plug in FBS logistics and the cost of your own packaging and delivery to the sorting centre. The formula is the same, the numbers are different.
What buyout rate should you assume? Your own actual one from the seller portal. For new products take the category average: clothes 30-60%, shoes lower still, products that need no fitting 85-95%.
Why does the profit in my sheet not match the money in my account? Because the account follows the settlement report, not the model: it holds actual deductions, penalties charged after the fact and adjustments. Reconcile the sheet with the report weekly, or hand the reconciliation to automation.