What Wildberries analytics is free in 2026: five portal reports without a subscription: summary, sales funnel (no impressions or CTR), order feed for 30 days, stock history for 3 months and the basic 'Search queries on WB' with marketplace-wide frequency. In the Analytics API without Jam the funnel, order feed, stocks and product rating work. Comparison with the marketplace, conversion per query, niches and unit economics only for 22,990–42,990 ₽ a month. The task map is below.
Free Wildberries analytics exists, and there is more of it than search results suggest, where the first places belong to services with the word "free" in the title. In 2026 the seller portal itself hands you, with no subscription, a summary, a sales funnel, an order feed, a stock history and a trimmed search query report. We checked that against six WB instructions, pulled from the Analytics API documentation the methods that work without Jem, and ran 5.63 million active catalogue cards through our crawler to show how much analytics lies in the open. Below is the map of what is free, the subscription line in roubles and two charts built on data the portal does not have.
In short: the WB portal gives you for free a summary, "Sales funnel. Comparison with a period" without impressions and CTR, an order feed for 30 days, three months of stock history and the basic version of "WB search queries". Comparison with the marketplace, the events calendar, niche analysis, queries for your own products, income and costs and unit economics come only with Jem, at 22,990 or 42,990 ₽ a month. In the Analytics API without a subscription you get the funnel, the order feed, stock and product rating.
What Wildberries analytics is free: a map by seller task
Tick what you need and the map shows where it lives: in the portal without a subscription, in the Analytics API, only in Jam, or in the public product card. Every line is checked against WB manuals updated from May to September 2026.
Which WB analytics you need and where it is free
Tick the tasks. For each we show whether it is in the portal without a subscription, in the Analytics API, only in Jam, or in the public product card. Jam prices per the WB notice of 2 March 2026.
Selected 4: without a subscription 3, Jam only 1
- free in the portalMy own funnel: clicks, carts, orders, buyouts: portal → Analytics → 'Sales funnel. Period comparison'; no impressions or CTR
- free in the portalSearch query frequency across the marketplace: portal → 'Search queries on WB', basic version: 500 rows on the web, up to 300,000 in XLSX
- public dataCompetitors' sales and prices: public product card: price, rating, reviews, some stocks; sales only as an estimate from stock movement
- Jam onlyUnit economics and income/expenses per item: Jam 'Advanced' 42,990 ₽/month; for free, worked out from the weekly report yourself
There are five free reports in the portal: summary, funnel, order feed, stock history, basic search queries. Everything else in the Analytics section is sold.
What is free in the Wildberries portal and what needs Jem
Five reports are free: "Analytics summary", "Sales funnel. Comparison with a period", "Order feed", "Stock history" (we took its formulas and statuses apart in the article on stock at WB warehouses) and the basic version of "WB search queries". Everything else in the "Analytics" section either comes with the Jem subscription or is sold separately, like the "Data" report on categories. We checked every line against WB instructions updated between May and September 2026, because in other people's reviews the "Events calendar" is still listed as free. In the instruction dated 3 September 2026 it is available only on the "Standard" and "Advanced" plans.
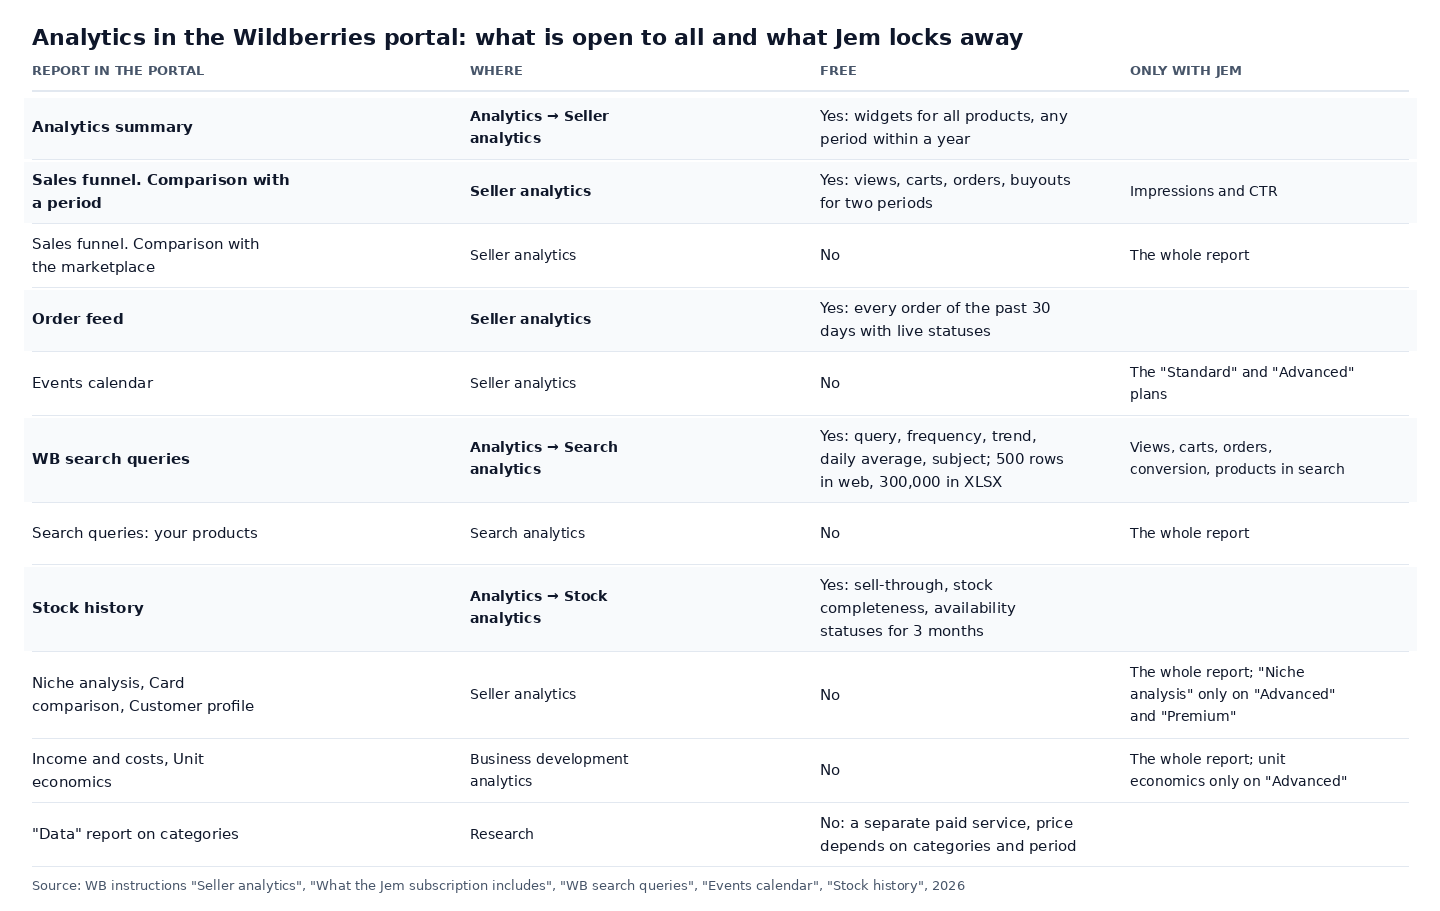
The free funnel honestly shows card views, add-to-carts, orders and buyouts for two periods of your choice. What it does not show is impressions and CTR, that is the top of the funnel: you see how many people opened the card, but not how many scrolled past it in search. The funnel's second tab, "Comparison with the marketplace", where your conversion rates sit next to the WB median, is closed entirely.
The order feed gives every order of the past 30 days with a real-time status, the dispatching warehouse and the customer's city. Three months of stock history count sell-through and how well the warehouse is stocked, and sort products by status from stock-out risk to dead stock. For a store that wants to know what runs out by Friday, that is enough. For the question "how much does the neighbour on the shelf sell", the free portal has nothing.
What the free "WB search queries" report gives
The free version shows five columns: the query itself, its change against the previous period, the number of entries for the period, the daily average and the subject most often ordered through it. This is data for the whole marketplace, not just your store, for yesterday, a week, a month or a quarter. The web table holds 500 rows, the XLSX export up to 300,000 queries, and there is one filter, by subject. The WB instruction of 24 August 2026 describes both versions side by side.
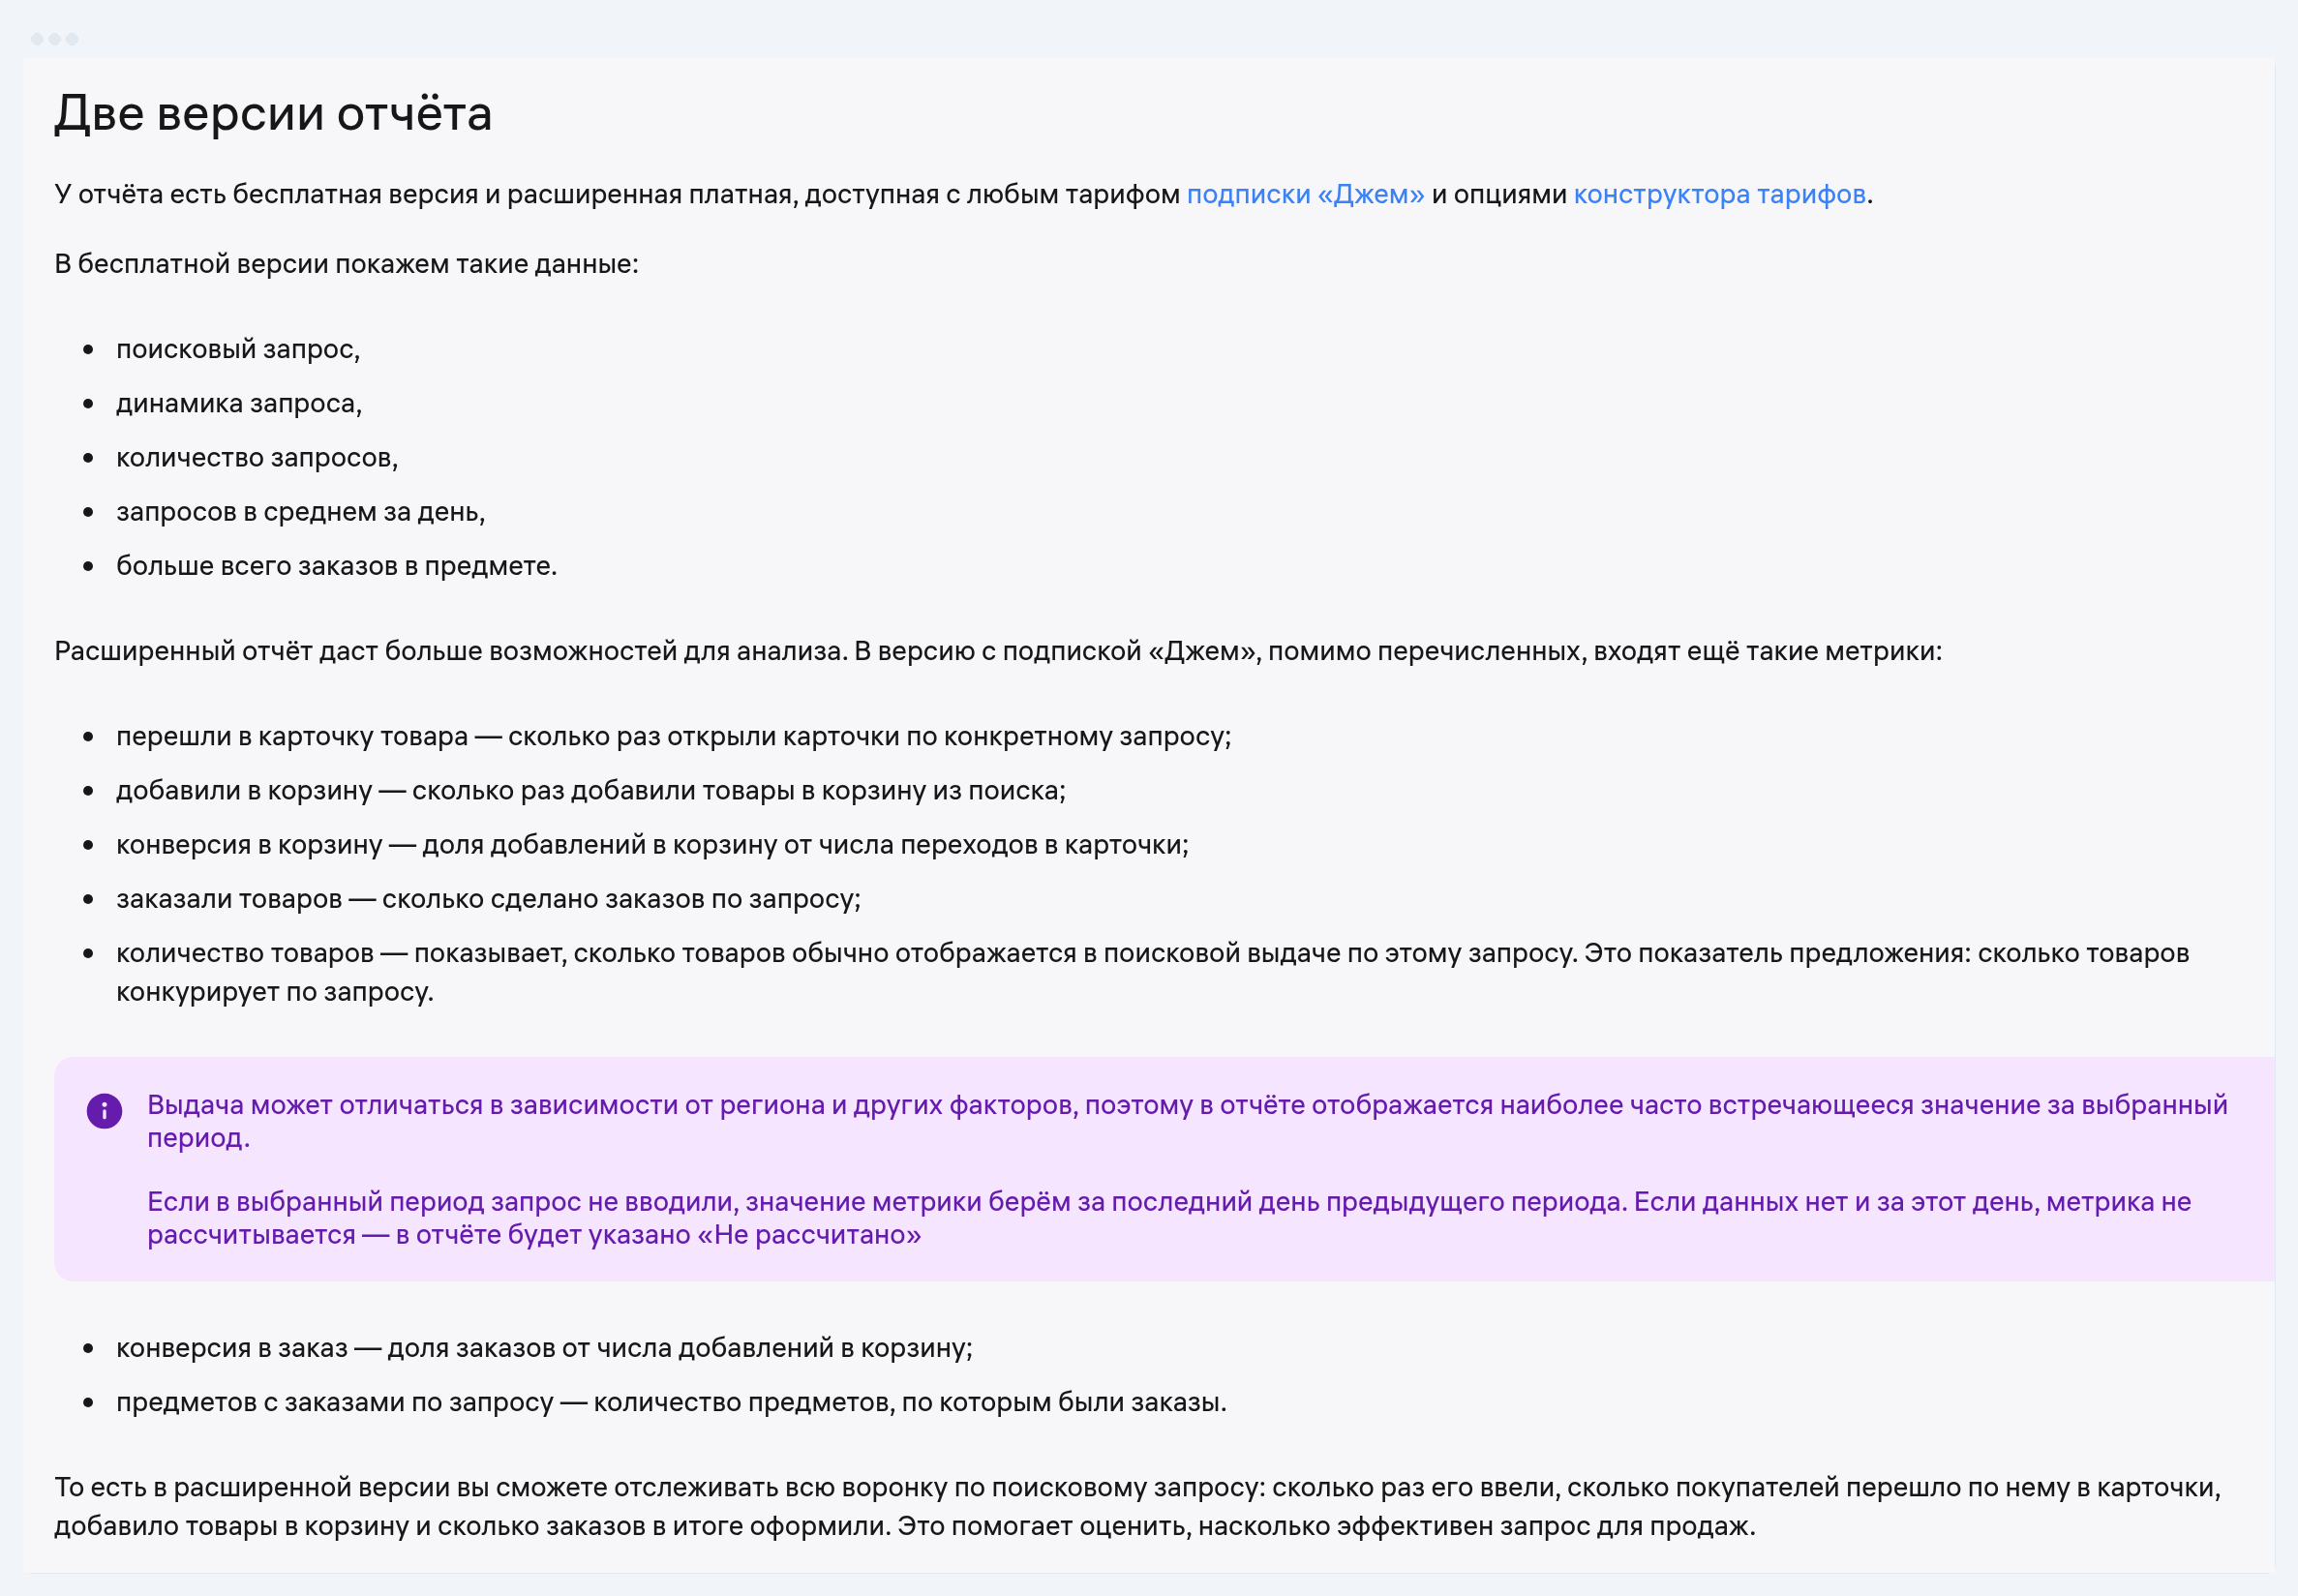
For building semantics that is enough: you have the frequency, you have the trend, and the subject with the most orders tells you which category to put the card in. What you do not have is conversion. How many times a query led to a card view, an add-to-cart and an order is shown only by the extended version, and it is the one that adds the "Number of products" column, that is the number of competitors in search. A query with 40,000 entries and 12,000 products in search and a query with 40,000 entries and 900 products look identical in the free report.
The report will not show queries with fewer than 30 customer actions over the period, or queries that are just article numbers. The low-frequency tails, which are often what brings a new card its first orders, stay out of the picture in both versions.
Which Analytics API methods work without a subscription
Without Jem, four groups of methods work in the Analytics API: the sales funnel (three sales-funnel methods of the third version), the order feed, stock reports and product rating. Only with a subscription do you get the "Search queries: your products" group and almost every CSV report, apart from stock history. That is written in the documentation at dev.wildberries.ru, we took a snapshot of it on 5 September 2026.
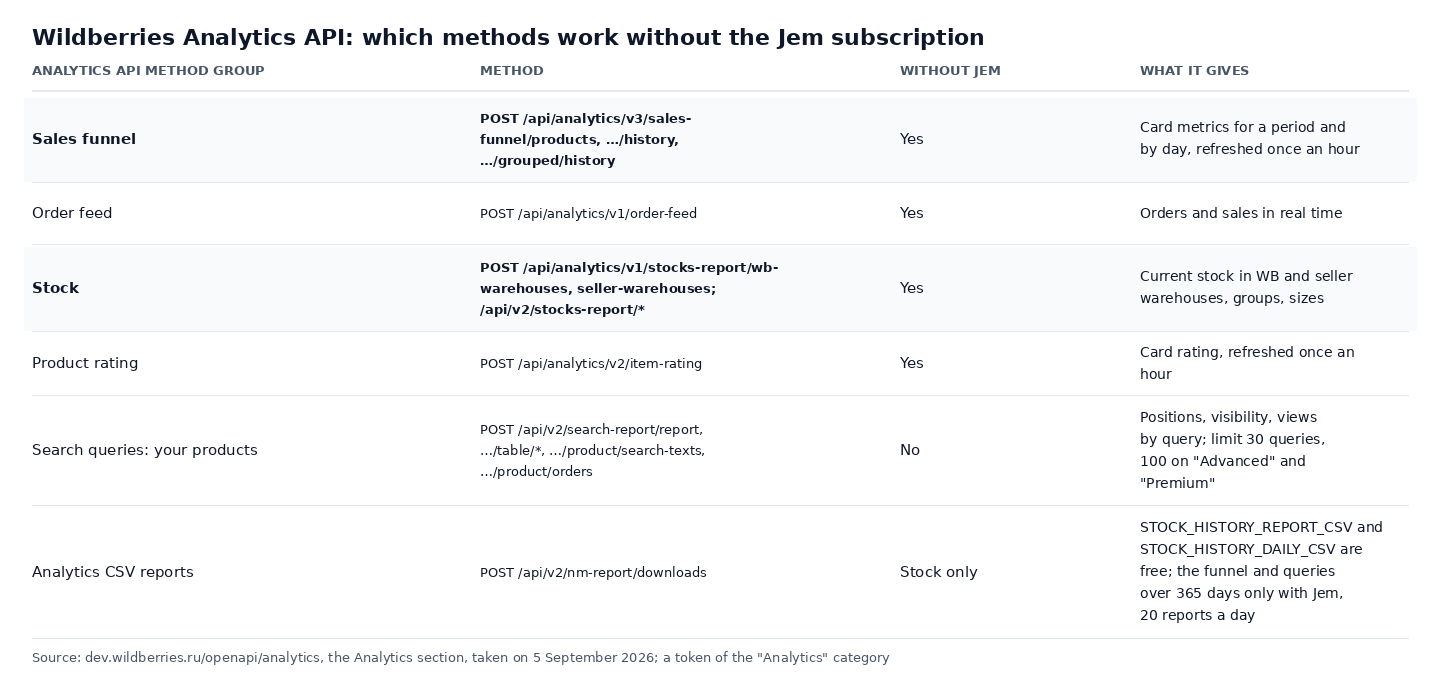
What this means in practice: the free API gives you, for every card, the same views, carts, orders and buyouts as the funnel in the portal, but by day and in a form you can stack into a table and keep. The portal summary shows data no deeper than a year, while an API export stays with you for good. For that you need a token of the "Analytics" category; how to create one and how a basic token differs from a personal one we covered in the article on the Wildberries API token.
There is one limit and it is noticeable: the CSV version of the funnel over 365 days, grouped by weeks and months, up to 20 reports a day, sits entirely behind Jem. Without a subscription the same archive is assembled with the "by day" method by hand, one request at a time.
What you can see in someone else's card without a token
A public product card on Wildberries shows the price before and after discount, the rating, the number of reviews, the seller, the brand, the subject, the delivery time, the number of photos and colours, and in some cards the warehouse stock. This is open data from the site, and it needs neither a portal nor a token. Every external analytics service is built on it, ours included.
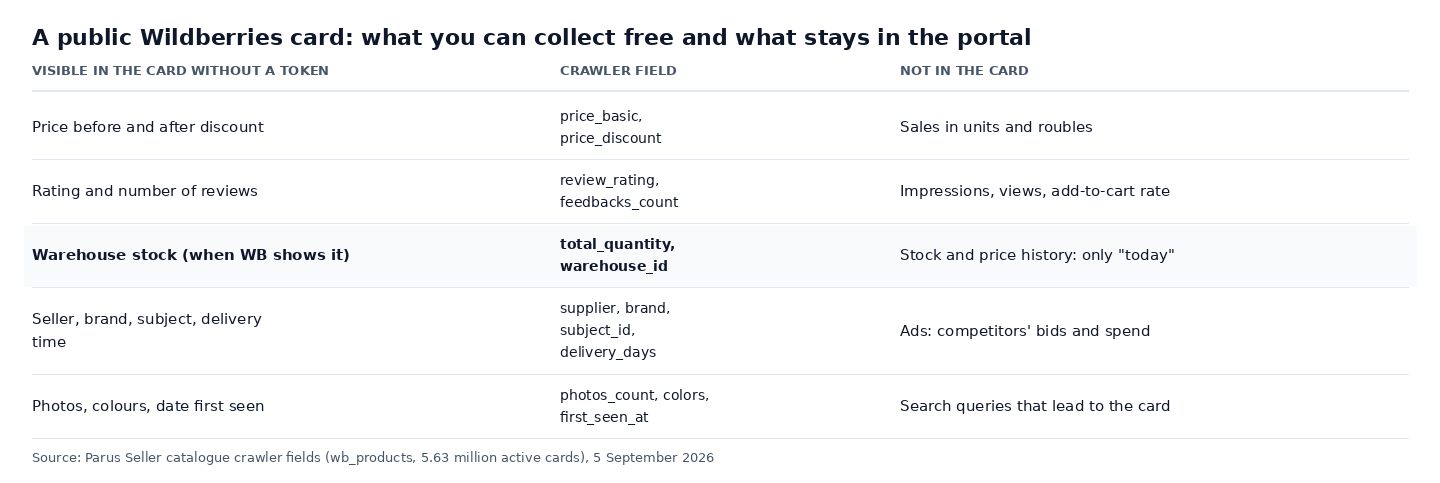
What the card does not have is sales. Not units, not roubles, not impressions, not conversions. Every "competitor's sales" figure in analytics services is an estimate from the movement of stock: stock was 120, became 97, so 23 were sold. The estimate works until the seller hides the stock or brings in a delivery in the middle of the day. When WB stops showing the stock, the estimate turns into a guess, and an honest service says so out loud.
The second thing missing from the card is history. The card shows today's price and today's stock. To see that the price has dropped by a fifth over a month and the stock ran out twice, someone had to open that card every day and write it down. Our database holds 6.5 million such daily metric snapshots, and it is the only way to get a trend, because the catalogue gives nothing back in hindsight.
What 5.6 million product cards show: our crawler's data
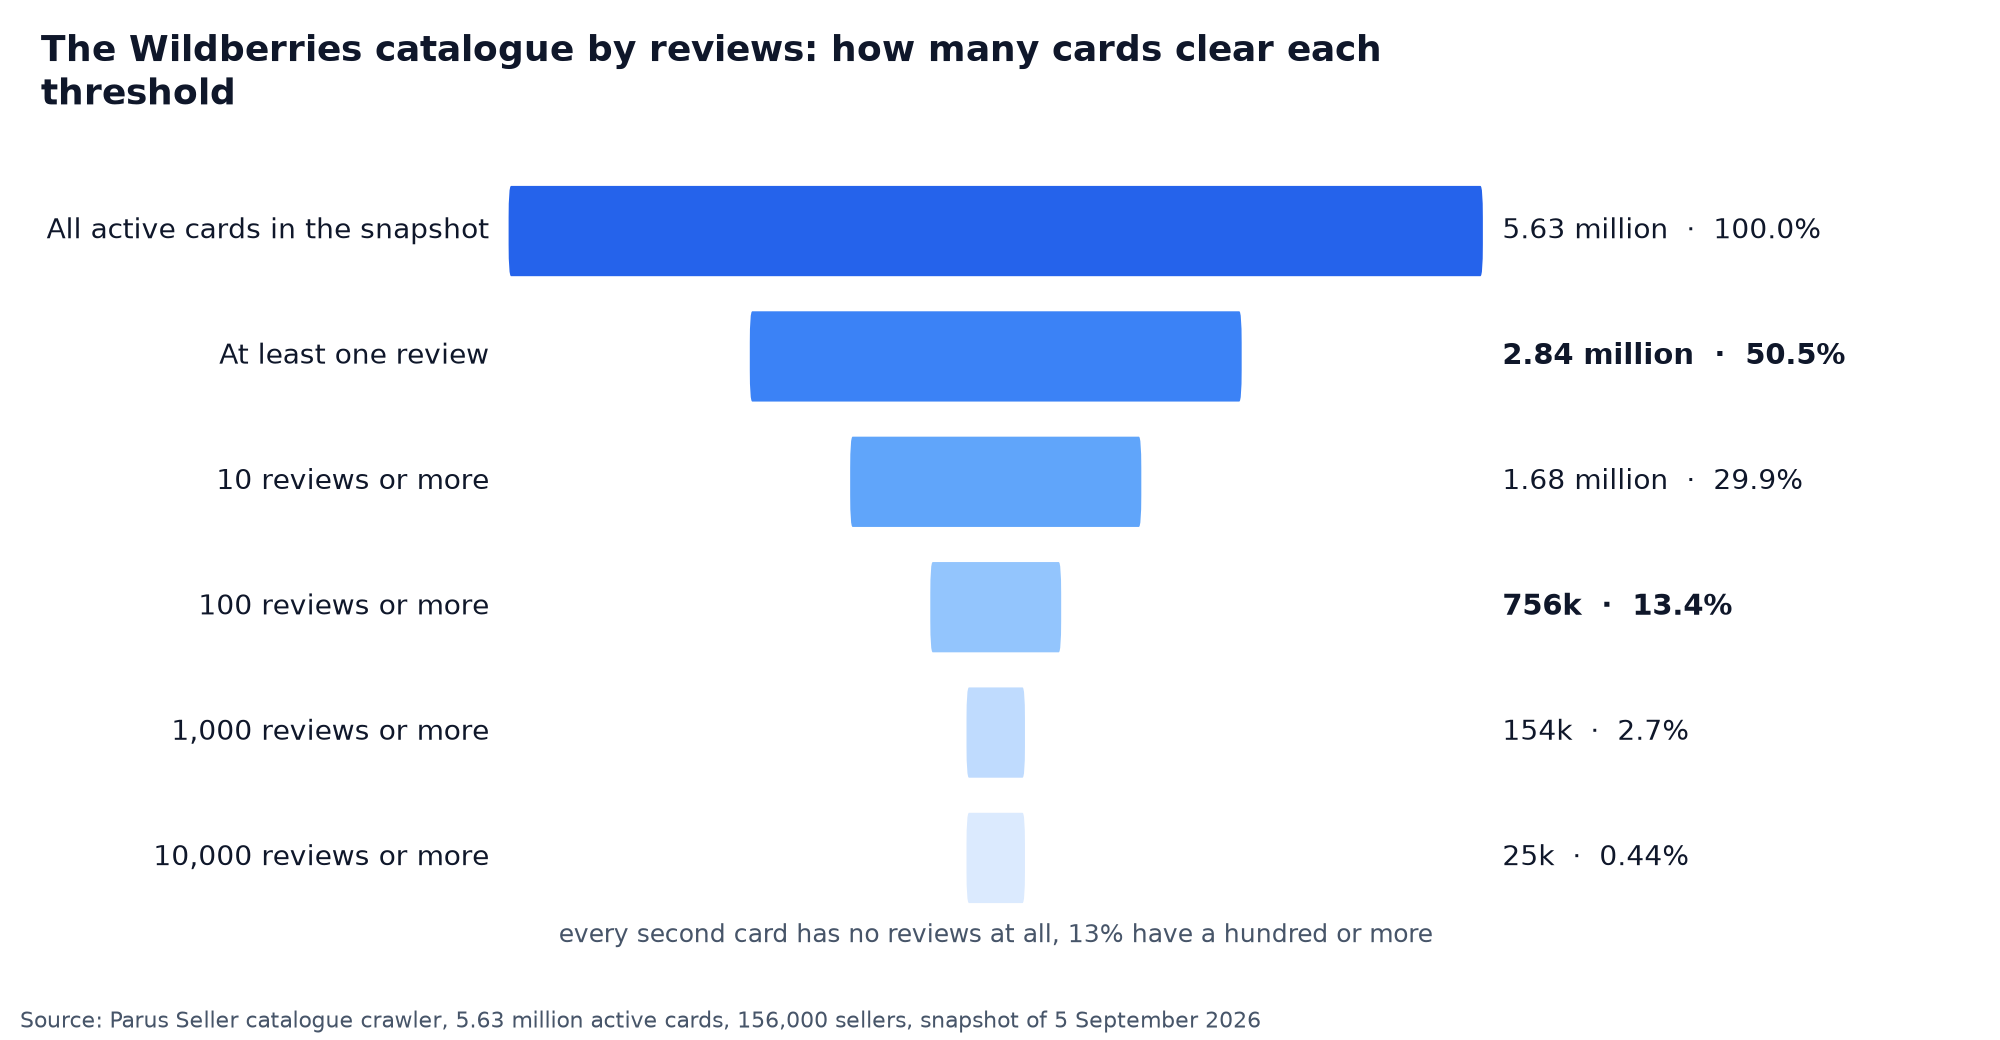
Our data shows that as of 5 September 2026 half of all active Wildberries cards have not a single review: 2.84 million out of 5.63 million. Ten reviews or more were collected by 29.9% of cards, a hundred by 13.4%, a thousand by 2.7%. Only some customers leave a review, so a hundred reviews means noticeably more than a hundred sales over the card's life. The other side of the same number: 86% of catalogue cards never reached a hundred reviews.
The second chart is about concentration. We sorted 2.84 million cards with reviews in descending order and counted the cumulative share: the top 1% of cards collected 60% of all 1.52 billion reviews, the top 10% collected 90%, and the bottom half of the catalogue with reviews holds half a percent between them. The dotted line on the chart shows what an even distribution would look like; the real curve is pressed into the top left corner.
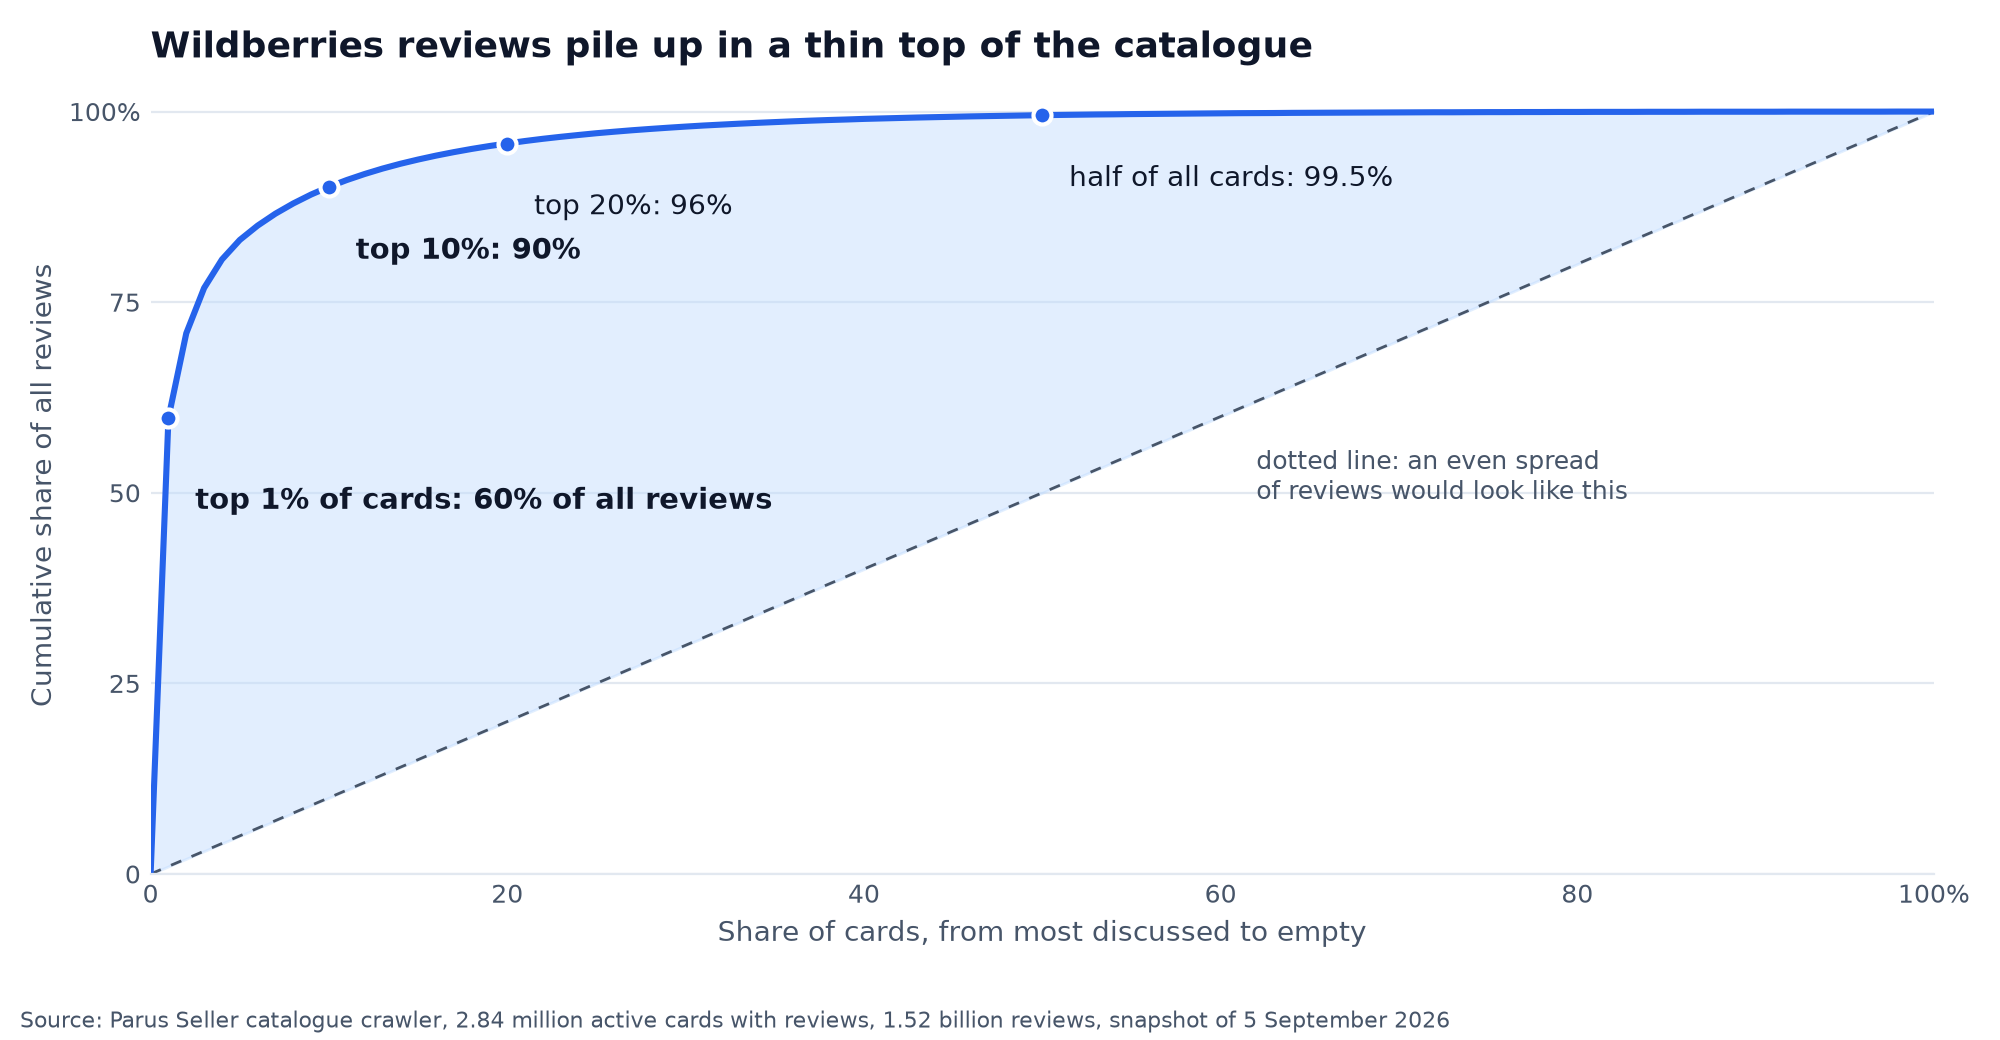
For a seller this leads to a simple conclusion about free analytics. Looking at the "category average" is pointless: the average is pulled up by that same 1%. It is more useful to find 20–30 cards in your subject with a hundred reviews or more and compare yourself with them on price, photos and rating. All of it is visible in a public card for free, and the spread of ratings we took apart in the article on replying to reviews.
Method: the crawler walks the WB catalogue category by category in waves; the snapshot covers cards it saw alive between November 2025 and September 2026, 5.63 million in total, from 156,000 sellers across 6,043 subjects. The median seller holds 3 cards, 28.5% of sellers have one card, 2.8% have more than a hundred. Some cards pulled from sale between passes are still in the snapshot, so we treat the review shares as a lower bound rather than an exact figure.
When free analytics is enough and when it is not
In our experience the free portal is enough for a store of up to 20–30 cards on one marketplace: your own funnel, your own orders, your own stock and query frequencies cover the daily decisions. It falls short in three cases: when you need to compare yourself with competitors, when you need history longer than a year, and when you need the economics of a product with commission, logistics and penalties from the weekly settlement report.
For comparison with the marketplace WB asks for Jem. Per the WB announcement of the price change from 2 March 2026, the "Standard" plan costs 22,990 ₽ for 30 days, "Advanced" with niche analysis and unit economics 42,990 ₽; there is also "Premium", whose price WB shows only inside the portal. A new seller gets a two-month demo period, and on first connection a 25% discount for the first two months and 24 hours of trial access, after which billing starts automatically.
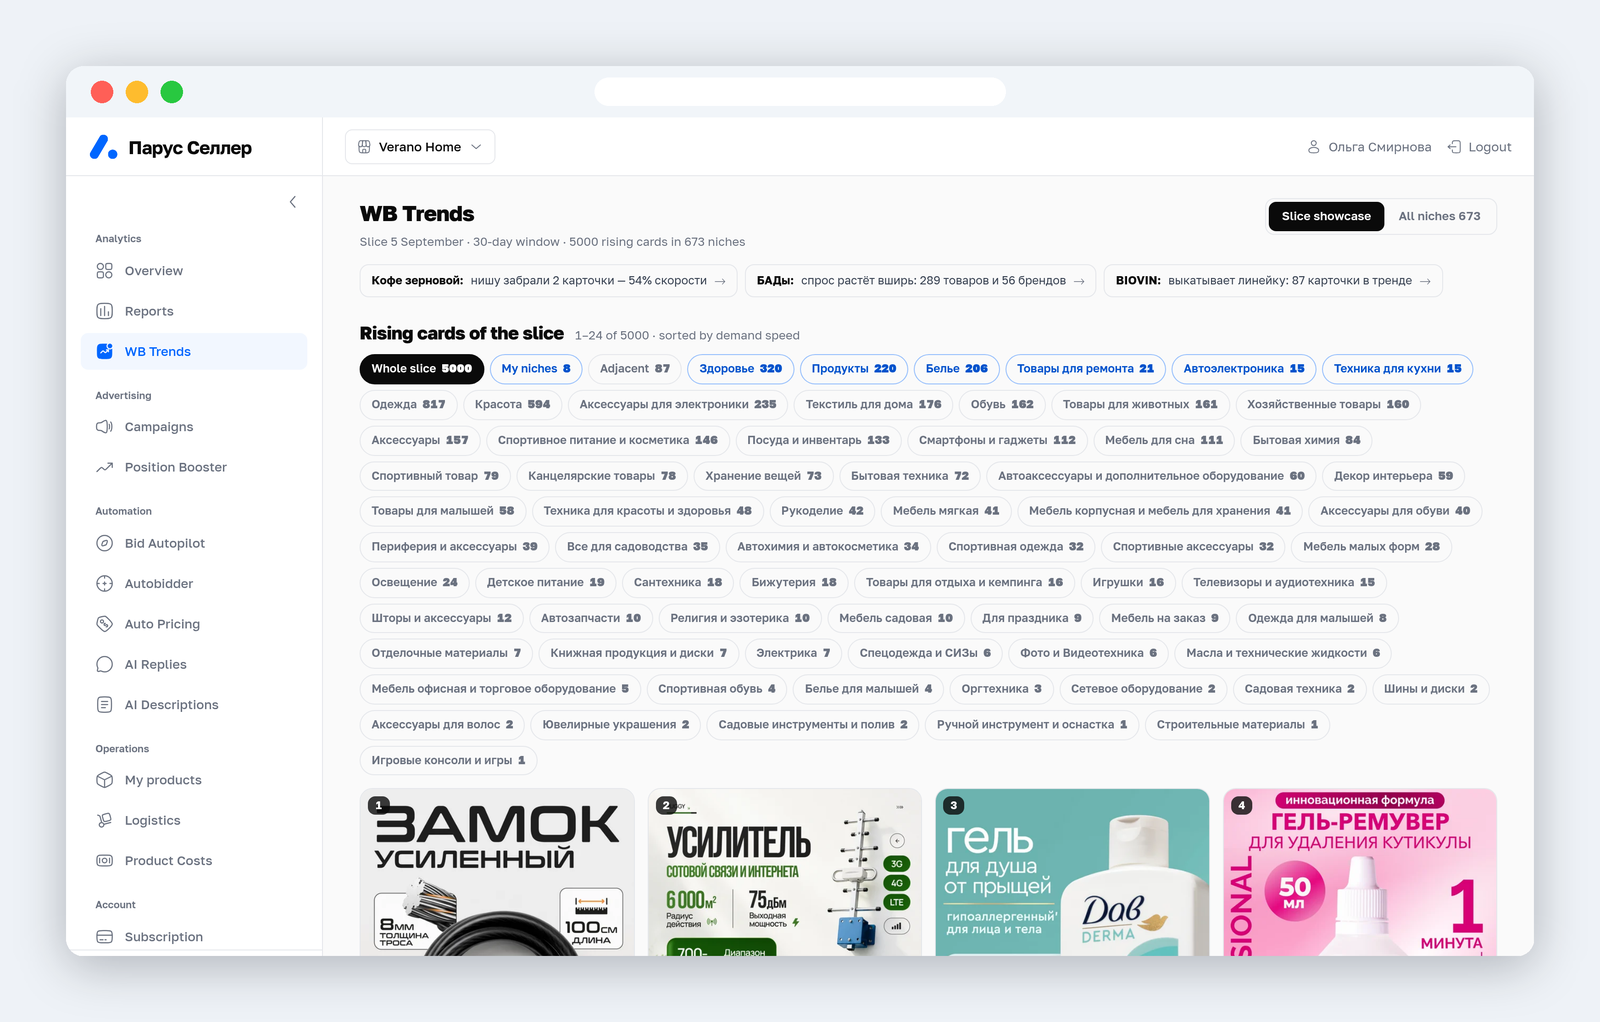
At Parus Seller we close the second and the third gap with our own data: the "WB Trends" page assembles a snapshot of 5,000 growing cards in 673 niches, ranking them by how fast new reviews appear, and the "Reports" tab takes the weekly settlement report apart to the rouble. Both tools run on the public catalogue and on free API methods, without Jem.
First two months free with promo code PARUS60, no card required: connect a store. A token of the "Analytics" category is created by the account owner and revoked in one click, and the service has no use for customers' personal data.
FAQ
Is there free Wildberries analytics without registering? Without registration you only get the public product card: price, rating, number of reviews, seller, sometimes stock. Portal reports, the free "WB search queries" included, need a seller account. Free modules in third-party services need registration with them.
Which Wildberries analytics service is free? There are no fully free ones, most have a free tier with limits: as of 5 September 2026 Marpla promises an SEO module for 50 phrases, Stat4Market free trends across 23 categories, WBcon free category analytics. Parus Seller gives two months of full access with promo code PARUS60.
What is Jem and how much does it cost in 2026? A WB subscription with extended analytics and promotion tools. From 2 March 2026 the "Standard" plan costs 22,990 ₽ for 30 days, "Advanced" 42,990 ₽. It is billed from the portal balance, and there is a 24-hour trial period.
How do I look at a product's analytics on WB for free? For your own product: "Analytics → Seller analytics", the "Sales funnel. Comparison with a period" tab, with views, carts, orders and buyouts for every card. For someone else's product: open the card on the site and write down the price, rating, reviews and stock, the history you will have to build up yourself.
Does the portal show Wildberries and Ozon analytics together? No, the Wildberries portal shows only Wildberries. External services can merge two marketplaces, but their competitor data for both is estimated, not taken from sellers' portals.