Wildberries warehouse stock shows up in three places in the seller portal and in two API reports, while a rival's stock is visible only on the storefront, where the total is capped. We read the WB instructions dated 27 August and 3 September 2026, wrote out the sell-through and status formulas, ran 2.4 million cards from search through our own crawler and made a live call to the public card API. The total on a card never climbs above 45 units, even when the sizes add up to 194, and cards with zero stock drop out of search altogether. Below is the map of sources, the report decoded, two charts, a table of live calls and the days of cover formula.
In short: your own FBW stock lives in the Stock history report (three months, sell-through, statuses from stock-out risk to dead stock), your FBS stock in Stock management, and the API serves it through the stock methods, which work without Jem. A rival's stock is visible only on the public card: the total is capped (45 units on a live call on 6 September 2026), the list of warehouses depends on the region, and WB search holds no cards with zero stock (407 out of 2.4 million). Days of cover = stock ÷ sales a day, and you compare them with your lead time, not with the calendar.
Where to see Wildberries stock: the portal, the API and the storefront
A seller sees their own stock in the Stock history report (both FBW and FBS), in the Stock management section (FBS only) and through the API; a rival's stock only on the public card. We checked the paths in the portal against the WB instruction on stock history dated 3 September 2026 and the instruction on FBS stock management dated 27 August, and the API methods against the documentation at dev.wildberries.ru, because other reviews still point at sections the portal dropped long ago.
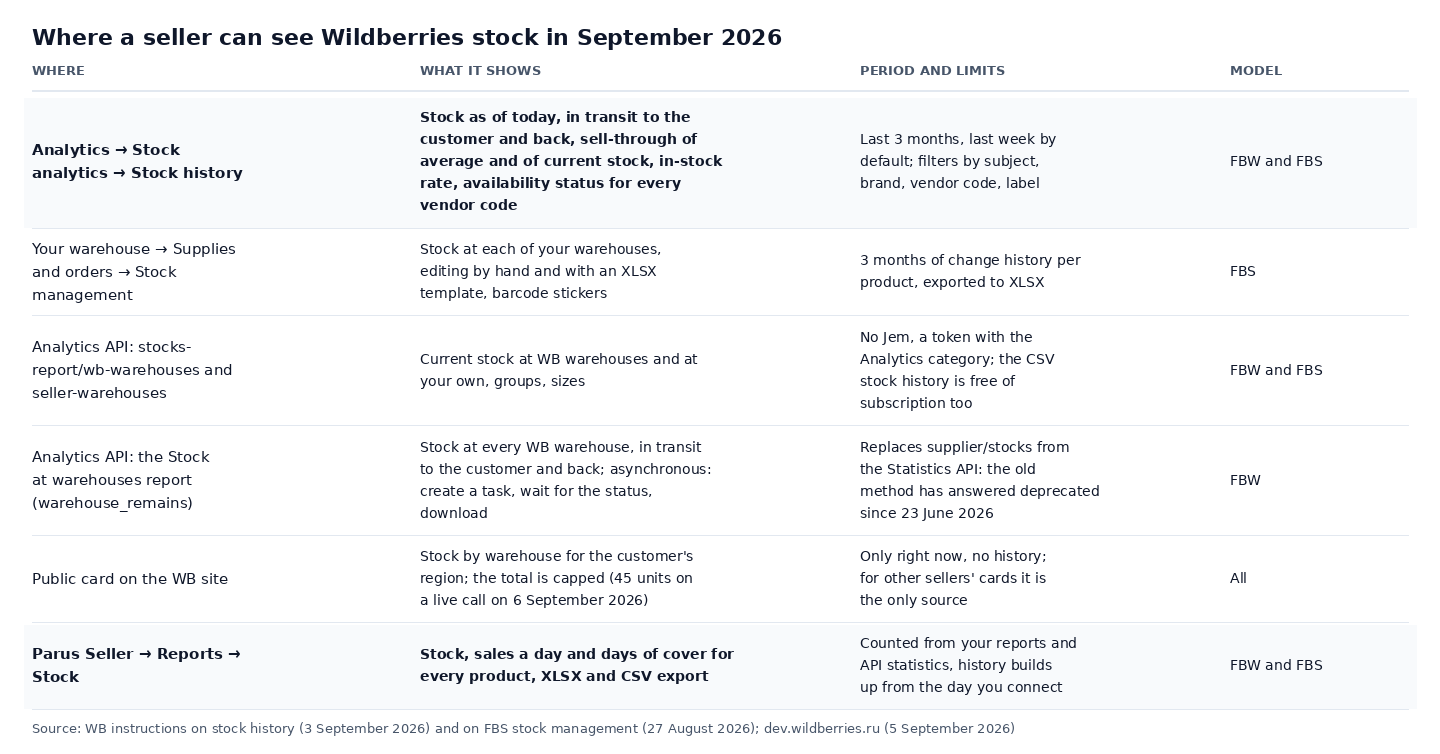
The Stock history report sits in Analytics → Stock analytics. By default it shows last week, the data is kept for three months, and there are filters by subject, brand, vendor code and labels. FBS stock lives in Supplies and orders → Stock management: you upload it by hand or with an XLSX template of two columns, Barcode and Quantity, and the site and the customer app pick the change up within 15 minutes. If the stock is there in the portal but the goods are not in the warehouse, an unfulfilled order brings a penalty, and we broke those amounts down in our article on Wildberries penalties for sellers.
Through the API, stock comes from two Analytics API reports, both without Jem and both on a token with the Analytics category: the report on stock at WB warehouses and at your own warehouses, and the asynchronous Stock at warehouses report broken down by every WB warehouse, where you create a task, wait for the status and download the file. The old stock method in the Statistics API has answered "deprecated" since 23 June 2026, and our own stock crawler moved to the report the same day. How to issue a token and which categories it needs we covered in the article on the Wildberries API token, and the full map of free portal reports in our piece on free Wildberries analytics.
What the Stock history report shows and how WB counts sell-through
The report counts two sell-through figures and the in-stock rate, and hands every vendor code one of five availability statuses. The formulas are taken from the WB instruction word for word. Sell-through of average stock is the average stock over the period divided by the average number of buyouts over the period. Sell-through of current stock is today's stock multiplied by the ratio of the time the goods were in stock to buyouts. The in-stock rate is 100% minus the share of time the goods were missing from the warehouse, and brief gaps count too.
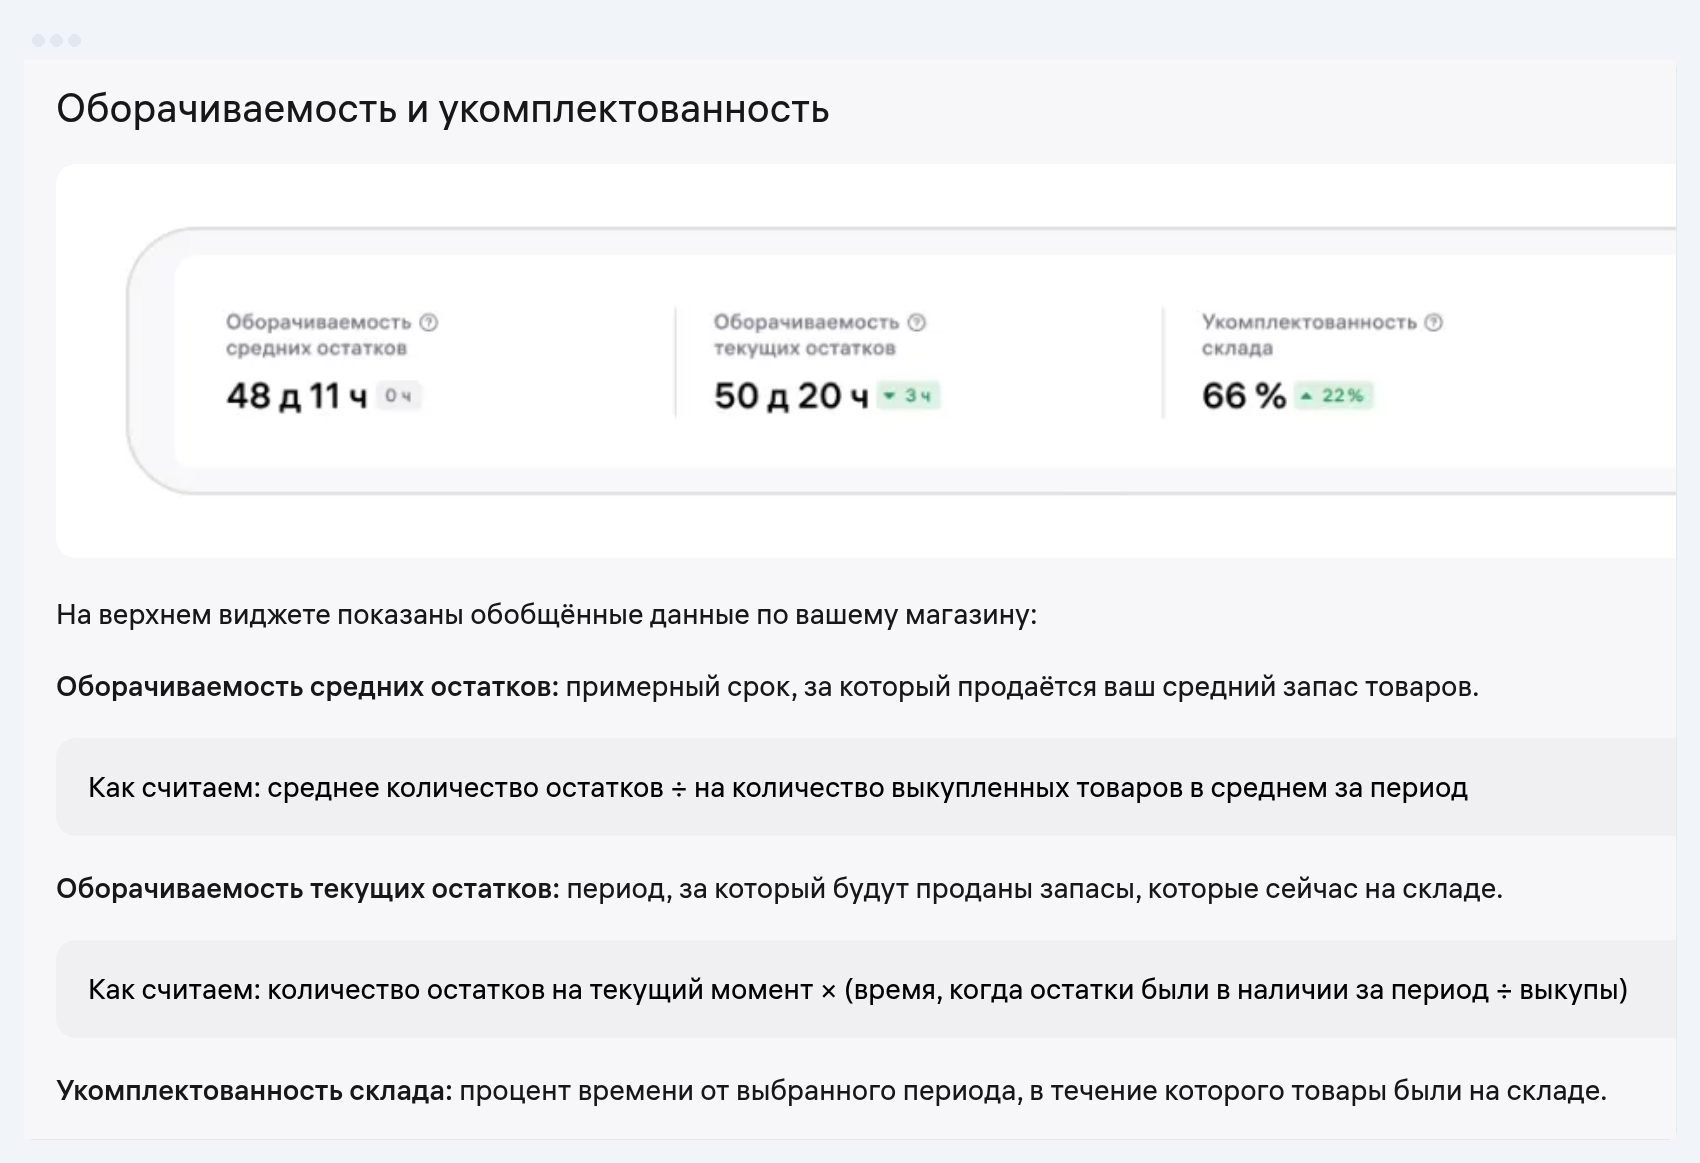
WB assigns availability statuses on two measures, sell-through of average stock and liquidity, and compares both with the averages for the subject over the last 7 days. There are five statuses: stock-out risk, in demand, balanced, out of demand and dead stock. The instruction gives an example for the last one: a product gets Dead stock when a unit sells 30% slower than the subject average or worse, and sell-through of average stock has reached 100 days. WB itself stresses that the statuses are advisory and do not affect your seller rating.
The report table switches between By product and By warehouse, breaks out by size and exports to Excel. The file has two sheets: Detailed information, with the stock as of today, and Stock by day, with the closing stock for every day of the period. For goods with a shelf life the stock column carries a grey badge that turns red 30 days before the date runs out. The three-month change history for FBS stock can be downloaded too: in Stock management every product has a Download change history item, and the file shows orders, adjustments and edits made through the API.
How many units sit behind a card in search: data on 2.4 million cards
Between 1 August and 6 September 2026 our crawler walked WB search by category and recorded 2,406,899 cards with the stock figure WB serves in the listing. First: 407 of them carry a zero, which is 0.02%. Wildberries search shows only goods in stock, so an empty warehouse means not a zero on the card but the card vanishing from search. Second: the more reviews a card has, the more units sit behind it.
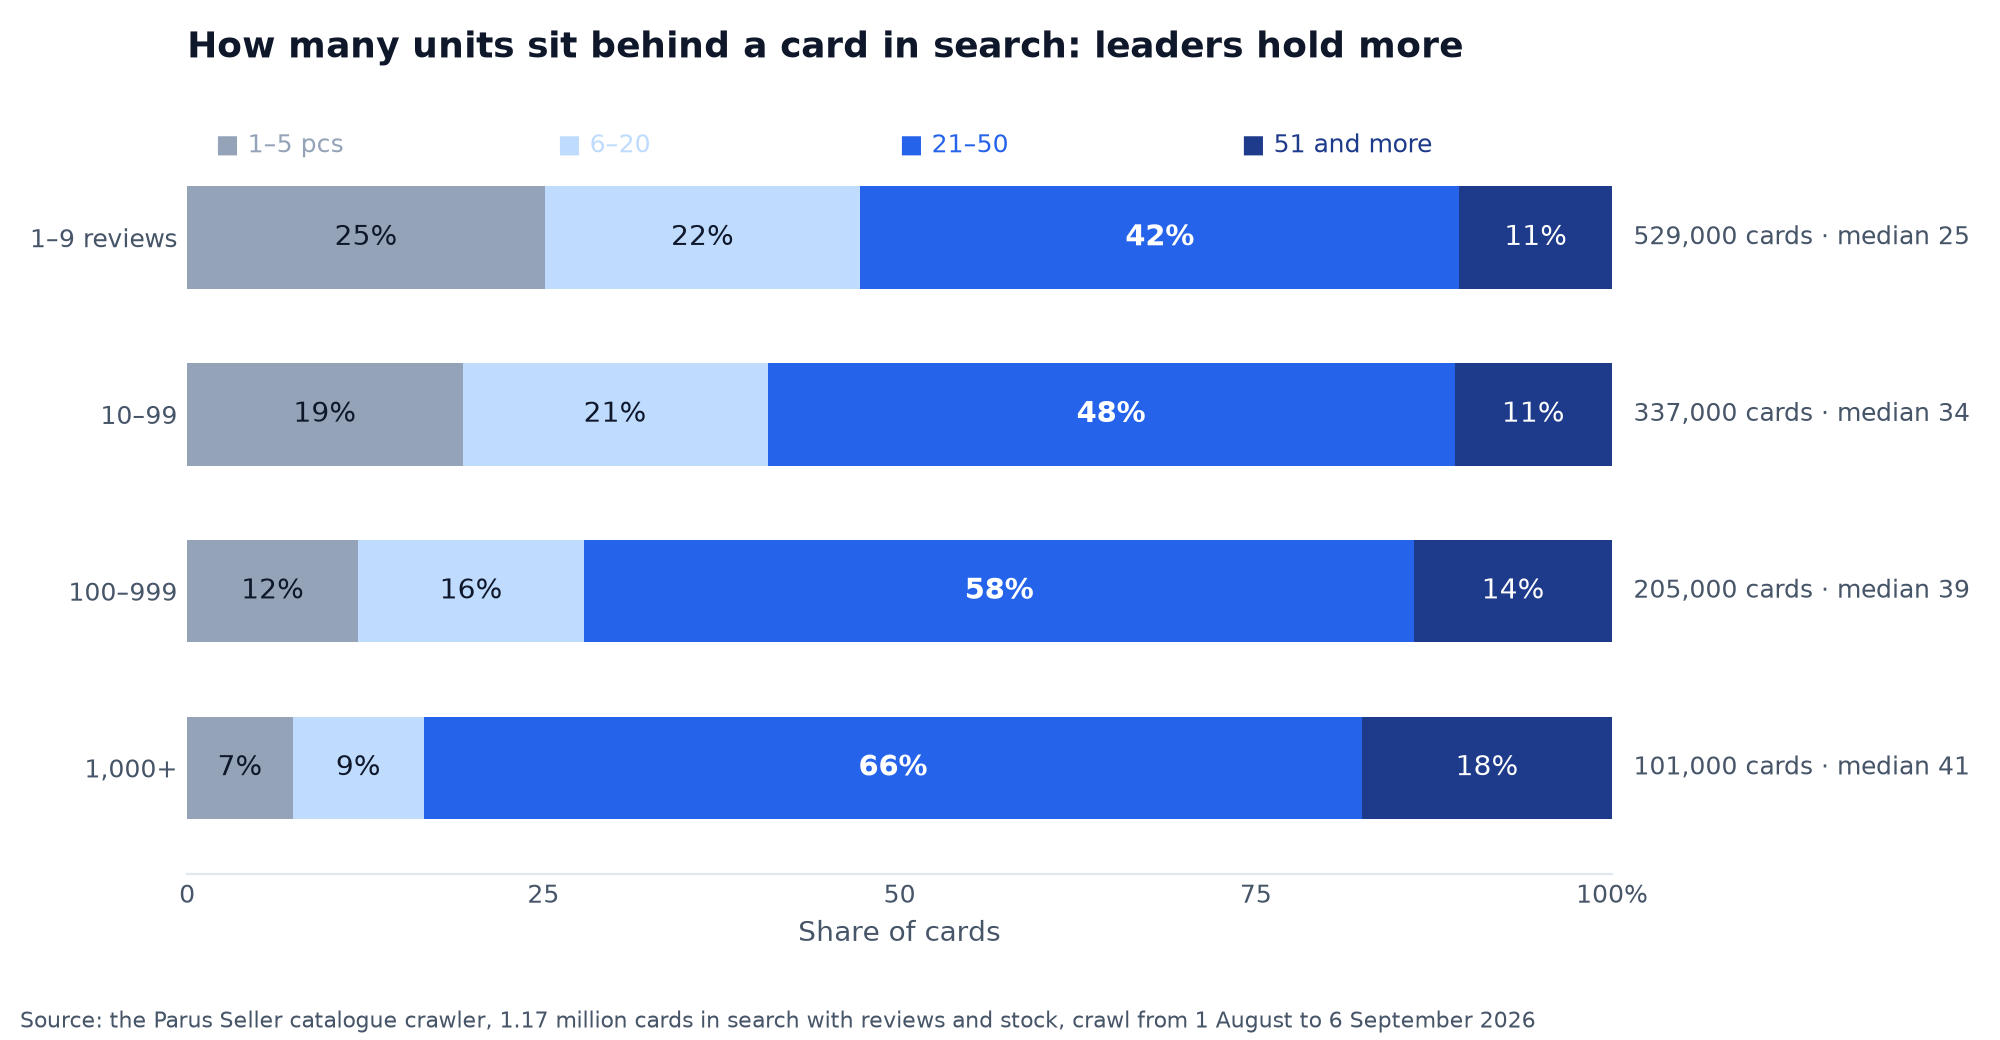
Among the 529,000 cards with 1–9 reviews, a quarter hold between 1 and 5 units, at a median of 25. Of the 101,000 cards with 1,000 reviews or more, only 7% do, and two thirds show between 21 and 50 units at a median of 41. Sellers starting out live from one supply to the next, and for a quarter of their range zero stock is one good day away. A leader never lets the warehouse run dry: dropping out of search costs a position, and winning it back is dearer than holding stock. The figure here is whatever search served at the moment of the crawl, so treat it as the storefront rather than WB's own stock accounting. For your own store the report numbers are more accurate.
Why the stock number on a rival's card is capped and how to read it
The total stock on a public WB card is capped, and the ceiling moves. In the August crawl the listing values cluster thickly up to 54 units, then break off, and above 70 there is not a single card out of 2.4 million. On a live card API call on 6 September 2026 every large card showed exactly 45, even though one of them held 194 units across eight sizes: both the total and each size are capped. A 45 or a 54 on someone else's card means "this many or more", not "this many".
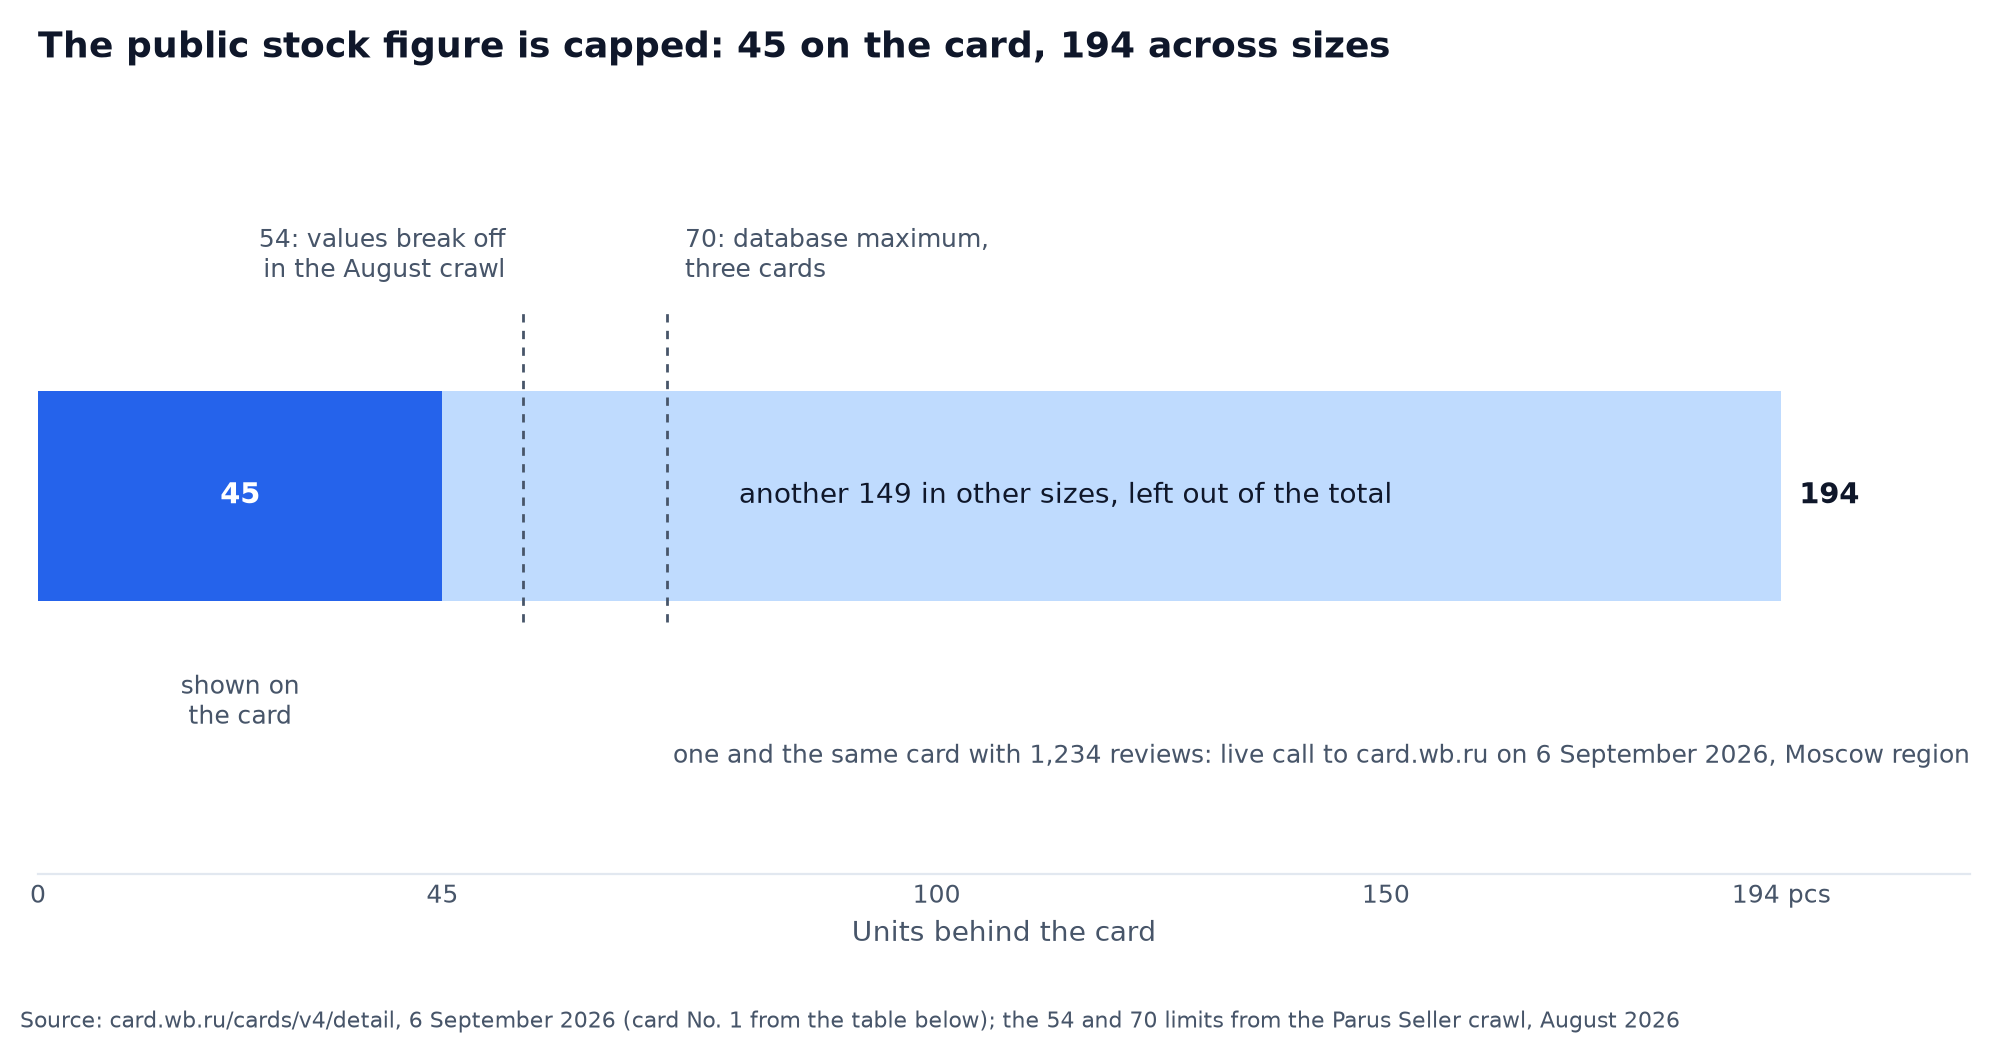
Three practical rules follow. First: if an analytics service draws a rival the same number at the ceiling week after week, that is not 45, it is 45 and more, and the real stock is unknown. Second: you can count a rival's sales from the drop in stock between snapshots only while the stock stays below the ceiling, because a capped card may sell 5 units in a day or 60 and the storefront will show one figure either way. Third: on cards with sizes the sum across sizes tells you more than the total, because every size is capped separately, and eight sizes add up to 194 while the total shows 45.
Why a zero on a rival's card does not mean sold out
A zero shown by an outside service more often means the card was not found in search than that the goods ran out. We checked this on our own data and got a result we did not enjoy. The crawler's database holds 2.75 million cards last seen in search in November 2025, and 95% of them are recorded with a zero. A live call on eight of those cards showed four genuinely empty, while four had stock of 45, 41, 9 and 3 units and had simply missed the crawl. Any service that counts stock from search results rather than from the card is wrong in exactly the same way.
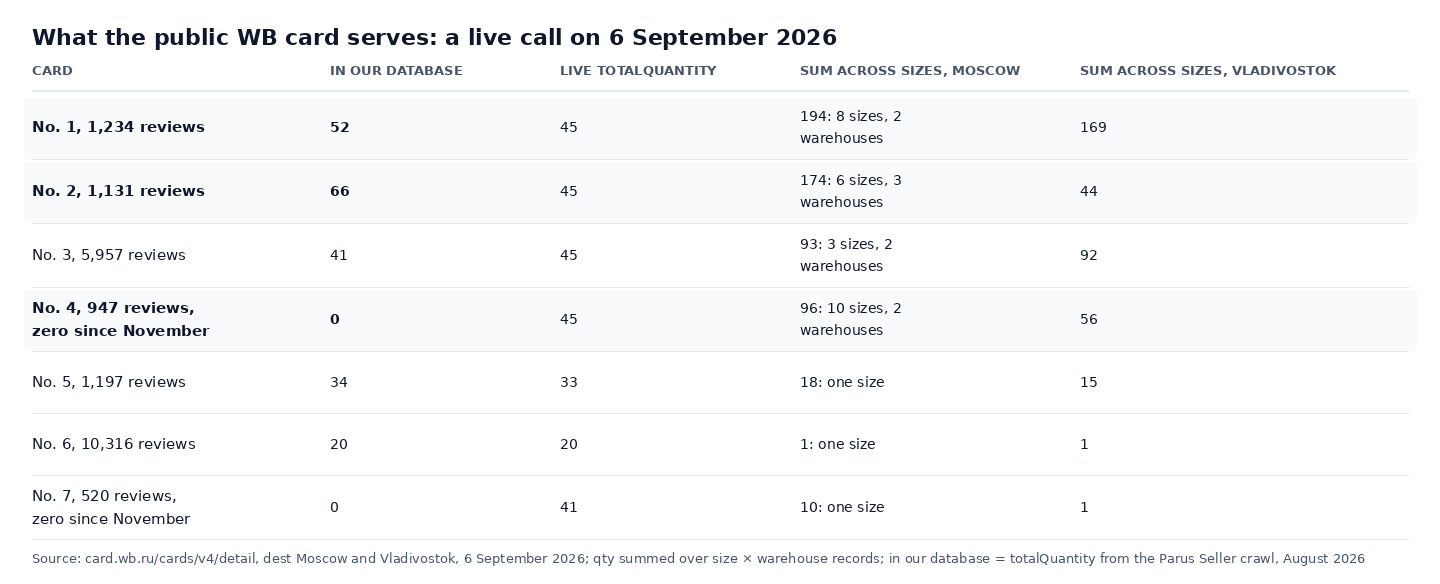
The table shows a second effect: which warehouse's stock goes into a size depends on the customer's region. Card No. 2 breaks down into 174 units across six sizes in Moscow and 44 in Vladivostok. The total is the same either way, 45, because it is capped. Card No. 5 works the other way round: the total stock is 33, while the single size at the warehouse serving Moscow shows 18. The total counts every WB warehouse, and the size shows only the warehouse that ships to the region. Read a rival's stock as a series of snapshots from one region, and take your own from the WB report or the API.
How to count days of cover and what Parus Seller does for you
Days of cover is stock divided by average sales a day over the last 30 days, and you compare it with your lead time, not with the month. If a supply to a WB warehouse takes you two weeks, anything with less than 14 days of cover is already late. In Parus Seller we count this for every product on the Stock tab of the Reports section, from the store's own API data: stock, units a day and days of cover, with export to XLSX and CSV. Below is the tab of the home textile store Marlen Textile.
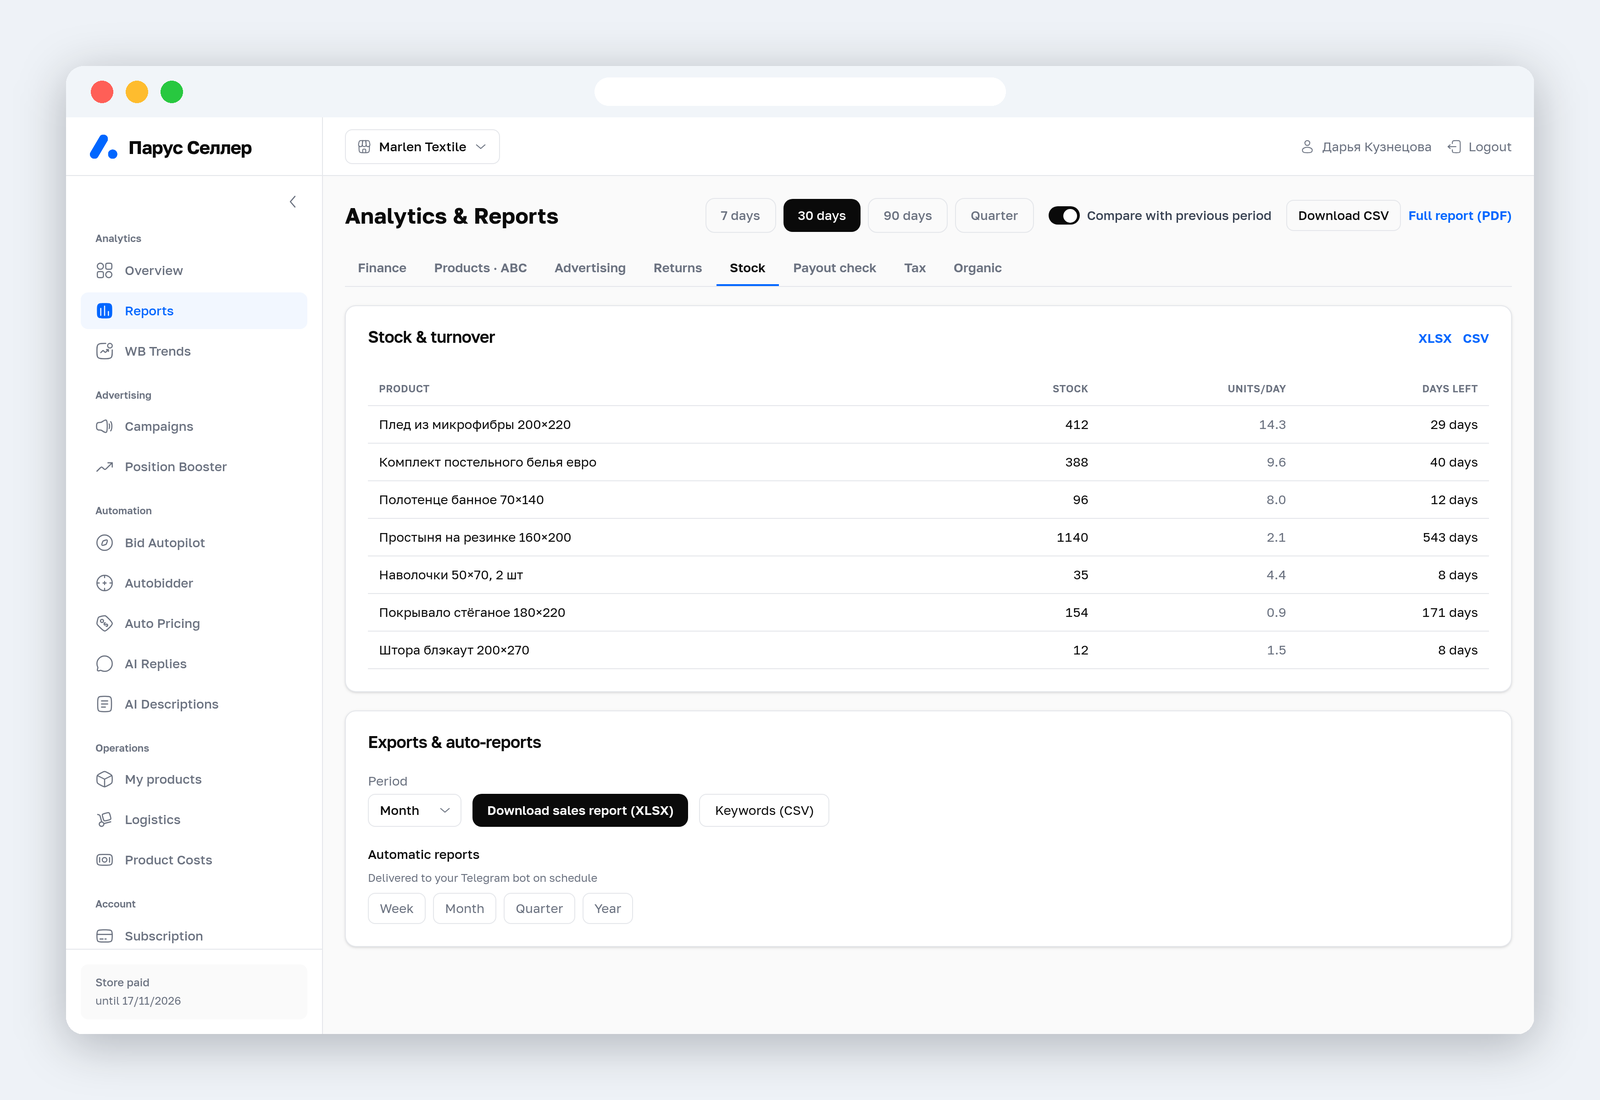
The seven products on the screen fall into three groups. The 200×220 throw, with 412 units in stock and 14.3 sales a day, has 29 days of cover, and the king-size bedding set has 40: that is balance. The pillowcases with 35 units at 4.4 a day and the blackout curtain with 12 units at 1.5 a day have 8 days each, so on a two-week lead time they are already short. The fitted sheet with 1,140 units at 2.1 a day has 543 days of cover and the bedspread has 171: by the WB criterion that is dead stock, and holding it costs more than clearing it at a discount. How to work out the discount and the logistics we covered in the article on the Wildberries buyout rate.
What the service does for you: it recounts days of cover every day from fresh sales, sends a stock report to Telegram on a schedule (weekly, monthly, quarterly or yearly) and keeps the history from the moment you connect the store, not three months like the portal. What it does not do: it does not create supplies and does not decide how much to ship for you. How to take the WB report itself apart we described in the article on the Wildberries weekly report.
FAQ
Where do I see Wildberries warehouse stock? In the seller portal: Analytics → Stock analytics → Stock history for every sales model, and Supplies and orders → Stock management for FBS. Through the API stock comes from the Analytics API: the stock report and the Stock at warehouses report. The old Statistics API method is switched off.
How do I see a competitor's stock on Wildberries? Only on their public card: the total is capped (45 units on a live call on 6 September 2026) and the list of warehouses is shown for the customer's region. There is no history there, so you need a service that takes the card regularly and shows a series rather than a single figure.
What is sell-through in the WB report? The time it takes to sell the stock. Sell-through of average stock is the average stock over the period divided by average buyouts, and sell-through of current stock is today's stock multiplied by the ratio of the time in stock to buyouts.
How long is stock history kept? Three months in the Stock history report, and three months for the FBS change history too. It lives longer only where you keep it yourself: in Excel exports or in a service connected through the API.
What does the Dead stock status mean in the report? The product barely sells. By the example in the WB instruction, a unit sells 30% slower than the subject average or worse, and sell-through of average stock has reached 100 days. WB recommends giving it the maximum discount and not restocking.
How do I upload FBS stock? By hand with the Add manually button, or with an XLSX template of the columns Barcode and Quantity, and through the template only quantities above zero go in. The storefront updates within 15 minutes, and after an order the stock goes down by itself.